
- Start >
- Rivers >
- Discharge >
- Obere Donau >
- Remshart >
- Chart of year

Chart of year Remshart / Kammel
Discharge from 01.01.2019 to 31.12.2019
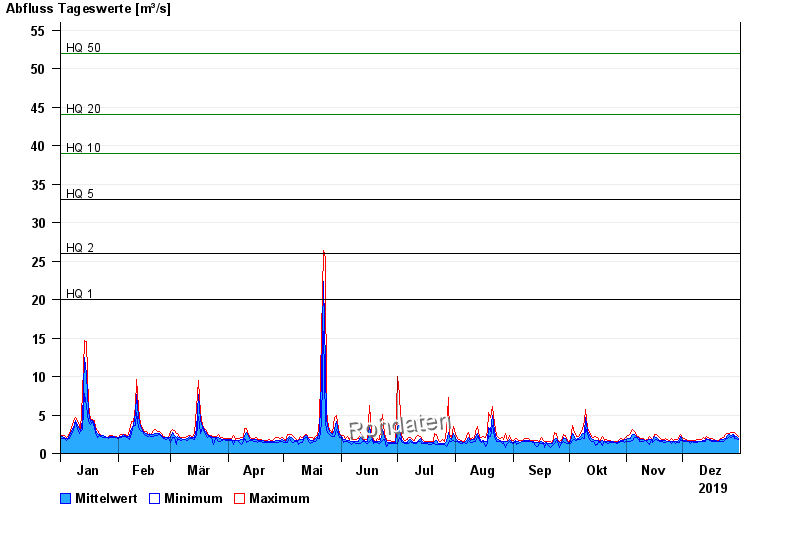
- HQ1 20 m³/s
- HQ2 26 m³/s
- HQ5 33 m³/s
- HQ10 39 m³/s
- HQ20 44 m³/s
- HQ50 52 m³/s
- HQ100 57 m³/s
| Date | Mean value [m³/s] | Maximum [m³/s] | Minimum [m³/s] |
|---|---|---|---|
| 31.12.2019 | 2 | 2.21 | 1.86 |
| 30.12.2019 | 2.18 | 2.47 | 1.98 |
| 29.12.2019 | 2.26 | 2.73 | 1.94 |
| 28.12.2019 | 2.49 | 2.73 | 2.3 |
| 27.12.2019 | 2.39 | 2.73 | 2.06 |
| 26.12.2019 | 2.47 | 2.58 | 2.18 |
| 25.12.2019 | 2.29 | 2.58 | 1.94 |
© Bayerisches Landesamt für Umwelt 2024