
- Start >
- Rivers >
- Discharge >
- Obere Donau >
- Reichenbach >
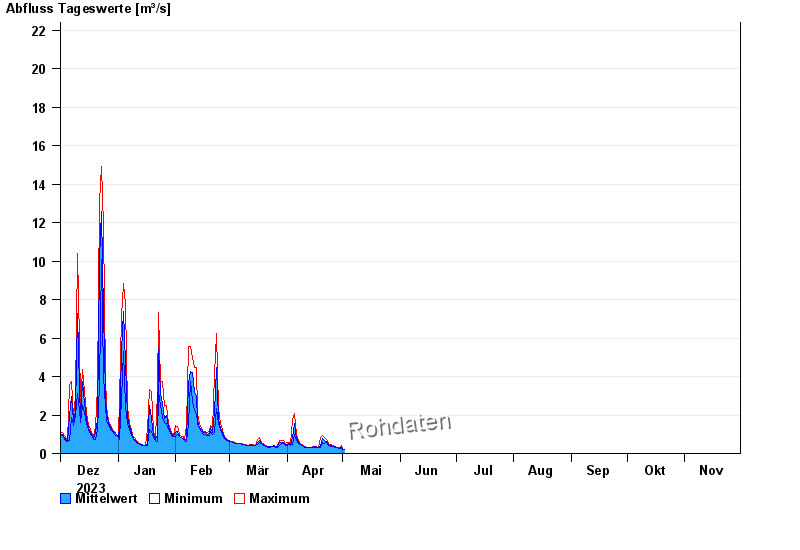
- Chart of year

Chart of year Reichenbach / Wörnitz
Discharge from 01.12.2023 to 30.11.2024
- 06.06.1984 Abfluss: 43,2 m³/s
- 01.06.2013 Abfluss: 37,6 m³/s
- 29.10.1998 Abfluss: 32,8 m³/s
- 22.05.1999 Abfluss: 31,5 m³/s
- 21.12.1993 Abfluss: 30,7 m³/s
| Date | Mean value [m³/s] | Maximum [m³/s] | Minimum [m³/s] |
|---|---|---|---|
| 04.06.2024 | 2.63 | 4.1 | 1.79 |
| 03.06.2024 | 8.68 | 14.1 | 4.1 |
| 02.06.2024 | 24.1 | 31.3 | 14.1 |
| 01.06.2024 | 8.18 | 17.6 | 1.79 |
| 31.05.2024 | 0.591 | 1.71 | 0.375 |
| 30.05.2024 | 0.396 | 0.522 | 0.288 |
| 29.05.2024 | 0.302 | 0.331 | 0.288 |
© Bayerisches Landesamt für Umwelt 2024