
- Start >
- Rivers >
- Discharge >
- Obere Donau >
- Pöttmes >
- Chart of year

Chart of year Pöttmes / Donaumoos Ach
Discharge from 01.01.2018 to 31.12.2018
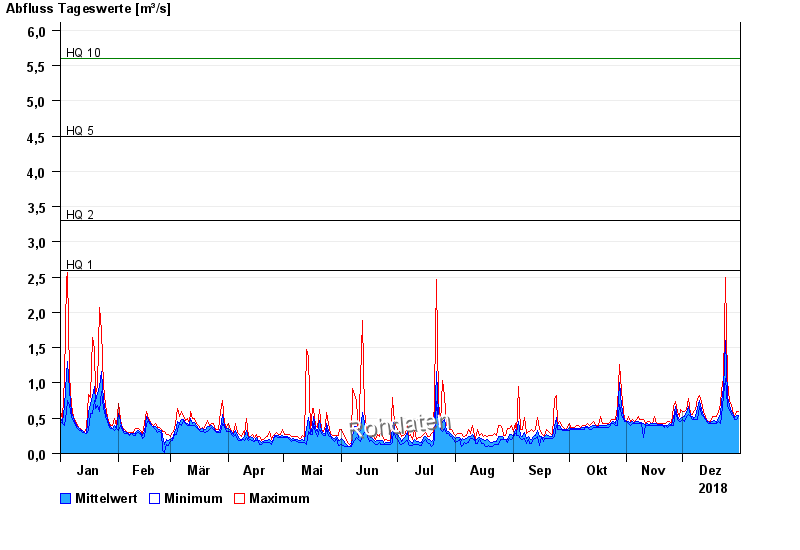
- HQ1 2,6 m³/s
- HQ2 3,3 m³/s
- HQ5 4,5 m³/s
- HQ10 5,6 m³/s
- HQ20 7 m³/s
- HQ50 9 m³/s
- HQ100 11 m³/s
| Date | Mean value [m³/s] | Maximum [m³/s] | Minimum [m³/s] |
|---|---|---|---|
| 31.12.2018 | 0.538 | 0.589 | 0.521 |
| 30.12.2018 | 0.54 | 0.589 | 0.489 |
| 29.12.2018 | 0.506 | 0.521 | 0.489 |
| 28.12.2018 | 0.535 | 0.554 | 0.521 |
| 27.12.2018 | 0.594 | 0.699 | 0.554 |
| 26.12.2018 | 0.674 | 0.736 | 0.625 |
| 25.12.2018 | 0.815 | 1.03 | 0.662 |
© Bayerisches Landesamt für Umwelt 2024