
- Start >
- Rivers >
- Discharge >
- Obere Donau >
- Pfaffenhofen >
- Chart of year

Chart of year Pfaffenhofen / Zusam
Discharge from 18.04.2020 to 17.04.2021
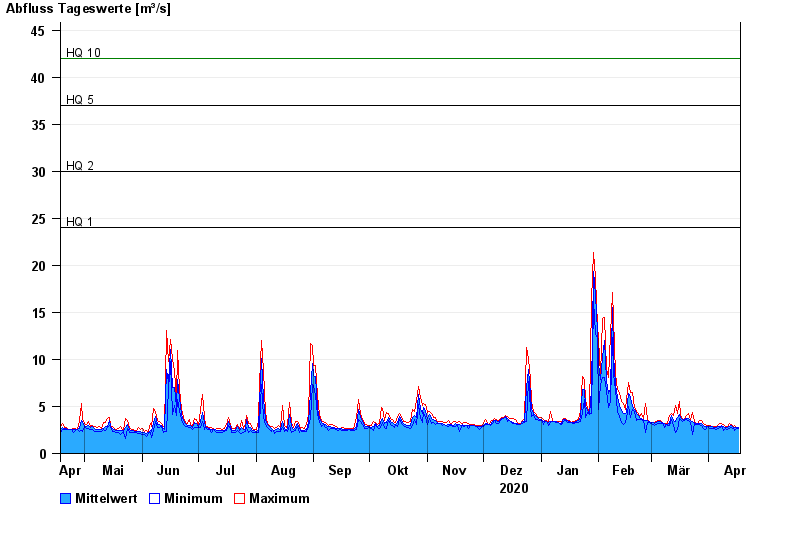
- HQ1 24 m³/s
- HQ2 30 m³/s
- HQ5 37 m³/s
- HQ10 42 m³/s
- HQ20 50 m³/s
- HQ50 62 m³/s
- HQ100 75 m³/s
| Date | Mean value [m³/s] | Maximum [m³/s] | Minimum [m³/s] |
|---|---|---|---|
| 17.04.2021 | 2.73 | 2.81 | 2.62 |
| 16.04.2021 | 2.73 | 2.81 | 2.62 |
| 15.04.2021 | 2.77 | 3.02 | 2.44 |
| 14.04.2021 | 2.8 | 2.92 | 2.62 |
| 13.04.2021 | 2.96 | 3.13 | 2.72 |
| 12.04.2021 | 2.9 | 3.24 | 2.63 |
| 11.04.2021 | 2.76 | 2.82 | 2.53 |
© Bayerisches Landesamt für Umwelt 2024