
- Start >
- Rivers >
- Discharge >
- Obere Donau >
- Oberndorf >
- Chart of year

Chart of year Oberndorf / Donau
Discharge from 20.09.2019 to 19.09.2020
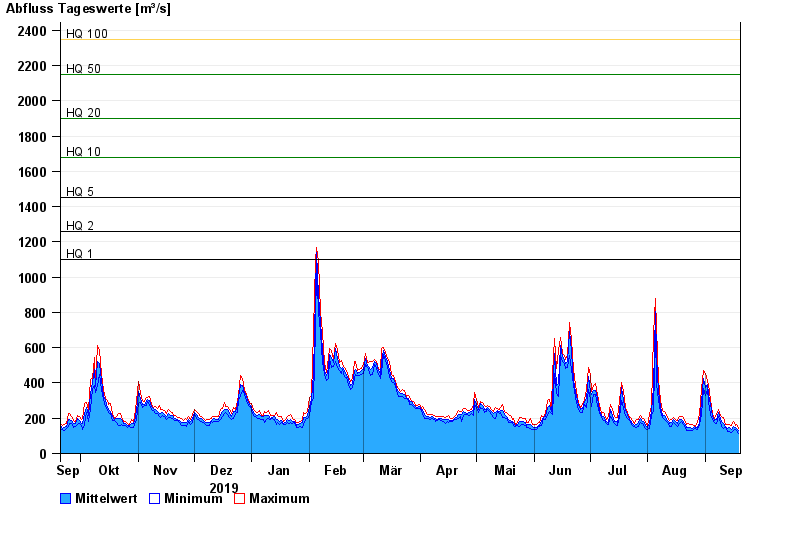
- HQ1 1100 m³/s
- HQ2 1260 m³/s
- HQ5 1450 m³/s
- HQ10 1680 m³/s
- HQ20 1900 m³/s
- HQ50 2150 m³/s
- HQ100 2350 m³/s
| Date | Mean value [m³/s] | Maximum [m³/s] | Minimum [m³/s] |
|---|---|---|---|
| 19.09.2020 | 132 | 143 | 116 |
| 18.09.2020 | 143 | 165 | 129 |
| 17.09.2020 | 145 | 157 | 135 |
| 16.09.2020 | 155 | 179 | 129 |
| 15.09.2020 | 138 | 159 | 119 |
| 14.09.2020 | 145 | 165 | 127 |
| 13.09.2020 | 139 | 165 | 124 |
© Bayerisches Landesamt für Umwelt 2024