
- Start >
- Rivers >
- Discharge >
- Obere Donau >
- Oberndorf >
- Chart of year

Chart of year Oberndorf / Donau
Discharge from 15.08.2021 to 14.08.2022
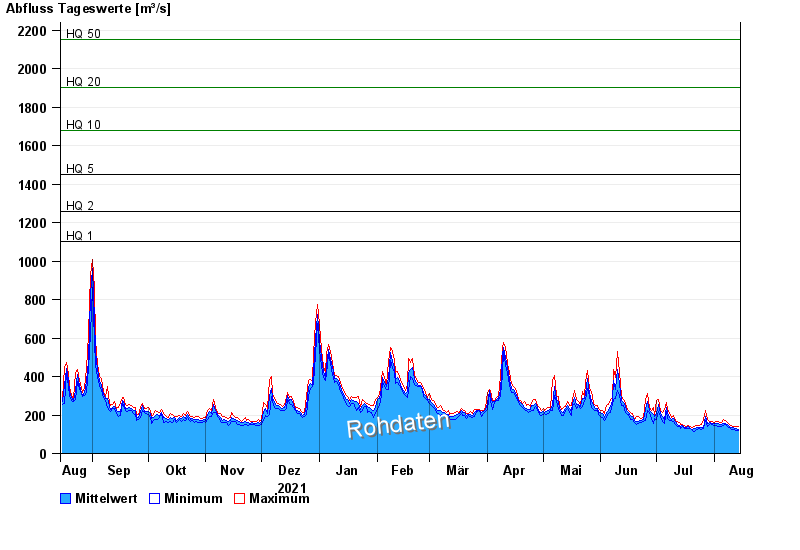
- HQ1 1100 m³/s
- HQ2 1260 m³/s
- HQ5 1450 m³/s
- HQ10 1680 m³/s
- HQ20 1900 m³/s
- HQ50 2150 m³/s
- HQ100 2350 m³/s
| Date | Mean value [m³/s] | Maximum [m³/s] | Minimum [m³/s] |
|---|---|---|---|
| 14.08.2022 | 127 | 139 | 122 |
| 13.08.2022 | 128 | 139 | 122 |
| 12.08.2022 | 130 | 142 | 125 |
| 11.08.2022 | 133 | 142 | 125 |
| 10.08.2022 | 136 | 148 | 125 |
| 09.08.2022 | 140 | 153 | 133 |
| 08.08.2022 | 149 | 159 | 139 |
© Bayerisches Landesamt für Umwelt 2024