
- Start >
- Rivers >
- Discharge >
- Obere Donau >
- Oberndorf >
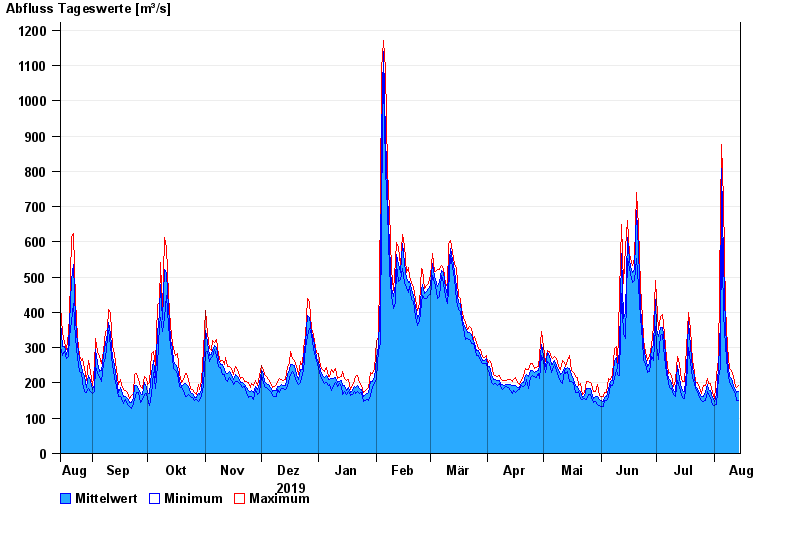
- Chart of year

Chart of year Oberndorf / Donau
Discharge from 15.08.2019 to 14.08.2020
| Date | Mean value [m³/s] | Maximum [m³/s] | Minimum [m³/s] |
|---|---|---|---|
| 14.08.2020 | 177 | 193 | 151 |
| 13.08.2020 | 172 | 187 | 151 |
| 12.08.2020 | 179 | 190 | 171 |
| 11.08.2020 | 194 | 219 | 179 |
| 10.08.2020 | 213 | 236 | 190 |
| 09.08.2020 | 217 | 242 | 202 |
| 08.08.2020 | 267 | 302 | 239 |
© Bayerisches Landesamt für Umwelt 2024