
- Start >
- Rivers >
- Discharge >
- Obere Donau >
- Oberndorf >
- Chart of year

Chart of year Oberndorf / Donau
Discharge from 29.11.2021 to 28.11.2022
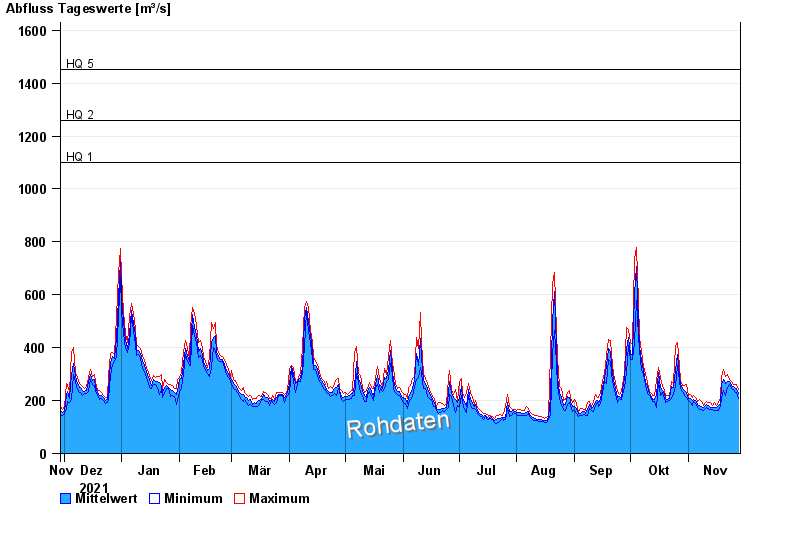
- HQ1 1100 m³/s
- HQ2 1260 m³/s
- HQ5 1450 m³/s
- HQ10 1680 m³/s
- HQ20 1900 m³/s
- HQ50 2150 m³/s
- HQ100 2350 m³/s
| Date | Mean value [m³/s] | Maximum [m³/s] | Minimum [m³/s] |
|---|---|---|---|
| 28.11.2022 | 226 | 241 | 209 |
| 27.11.2022 | 245 | 259 | 232 |
| 26.11.2022 | 248 | 262 | 235 |
| 25.11.2022 | 253 | 262 | 241 |
| 24.11.2022 | 258 | 271 | 244 |
| 23.11.2022 | 271 | 280 | 259 |
| 22.11.2022 | 273 | 298 | 250 |
© Bayerisches Landesamt für Umwelt 2024