
- Start >
- Rivers >
- Discharge >
- Obere Donau >
- Obermenzing >
- Chart of year

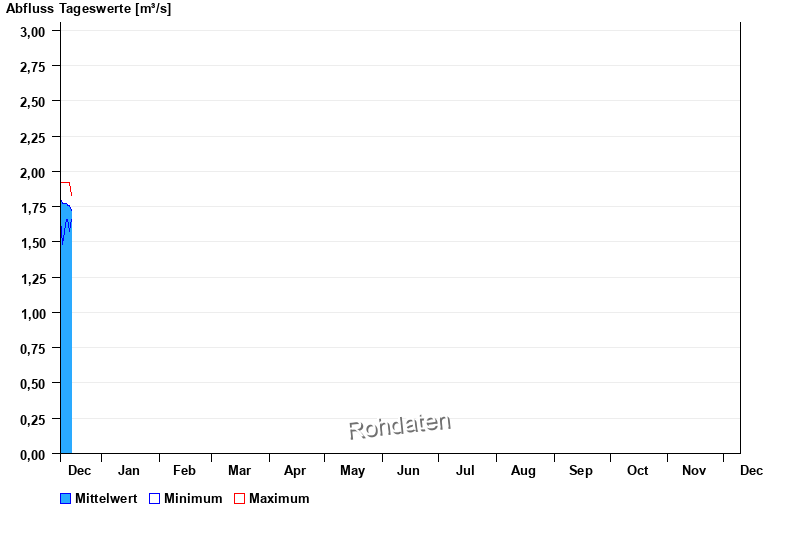
Chart of year Obermenzing / Würm
Discharge from 10.12.2025 to 09.12.2026
- 19.07.1999 Abfluss: 9,54 m³/s
- 31.08.2010 Abfluss: 8,64 m³/s
- 07.08.2010 Abfluss: 8,64 m³/s
- 19.08.2010 Abfluss: 8,53 m³/s
- 14.10.2024 Abfluss: 8,5 m³/s
| Date | Mean value [m³/s] | Maximum [m³/s] | Minimum [m³/s] |
|---|---|---|---|
| 16.12.2025 | 1.72 | 1.83 | 1.48 |
| 15.12.2025 | 1.76 | 1.92 | 1.57 |
| 14.12.2025 | 1.76 | 1.92 | 1.66 |
| 13.12.2025 | 1.77 | 1.92 | 1.66 |
| 12.12.2025 | 1.77 | 1.92 | 1.57 |
| 11.12.2025 | 1.77 | 1.92 | 1.48 |
| 10.12.2025 | 1.8 | 1.92 | 1.66 |
© Bayerisches Landesamt für Umwelt 2025