
- Start >
- Rivers >
- Discharge >
- Obere Donau >
- Obermenzing >
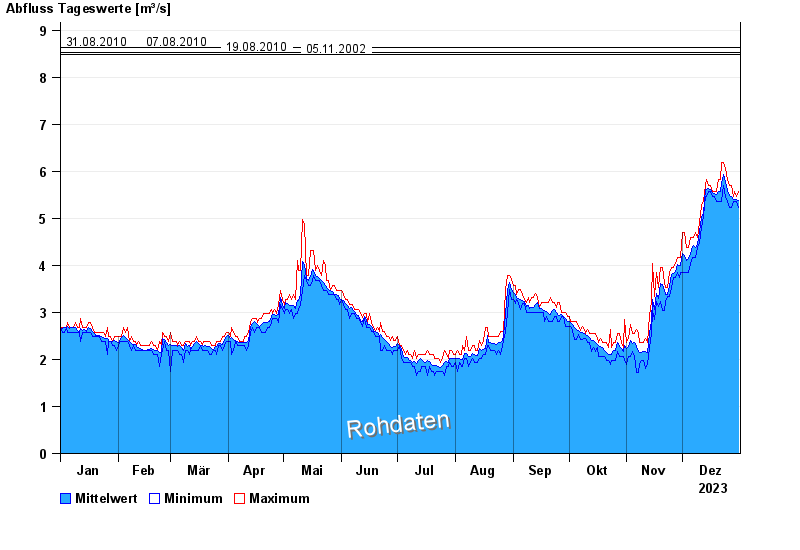
- Chart of year

Chart of year Obermenzing / Würm
Discharge from 01.01.2023 to 31.12.2023
- 19.07.1999 Abfluss: 9,54 m³/s
- 31.08.2010 Abfluss: 8,64 m³/s
- 07.08.2010 Abfluss: 8,64 m³/s
- 19.08.2010 Abfluss: 8,53 m³/s
- 14.10.2024 Abfluss: 8,5 m³/s
| Date | Mean value [m³/s] | Maximum [m³/s] | Minimum [m³/s] |
|---|---|---|---|
| 31.12.2023 | 5.24 | 5.38 | 5.14 |
| 30.12.2023 | 5.26 | 5.34 | 5.21 |
| 29.12.2023 | 5.27 | 5.39 | 5.17 |
| 28.12.2023 | 5.26 | 5.33 | 5.19 |
| 27.12.2023 | 5.31 | 5.48 | 5.1 |
| 26.12.2023 | 5.34 | 5.53 | 5.11 |
| 25.12.2023 | 5.45 | 5.64 | 5.19 |
© Bayerisches Landesamt für Umwelt 2025