
- Start >
- Rivers >
- Discharge >
- Obere Donau >
- Obermenzing >
- Chart of year

Chart of year Obermenzing / Würm
Discharge from 01.01.2024 to 31.12.2024
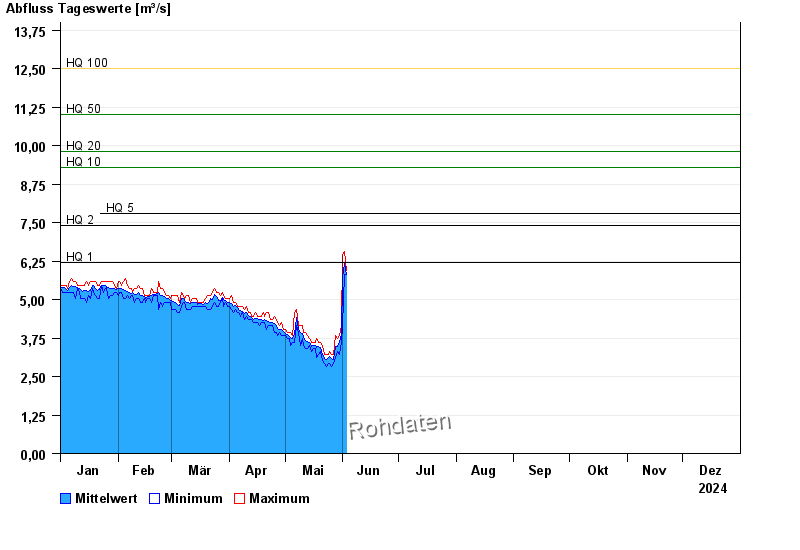
- HQ1 6,2 m³/s
- HQ2 7,4 m³/s
- HQ5 7,8 m³/s
- HQ10 9,3 m³/s
- HQ20 9,8 m³/s
- HQ50 11 m³/s
- HQ100 12,5 m³/s
| Date | Mean value [m³/s] | Maximum [m³/s] | Minimum [m³/s] |
|---|---|---|---|
| 31.12.2024 | 4.52 | 5.61 | 4.17 |
| 30.12.2024 | 4.55 | 5.78 | 4.21 |
| 29.12.2024 | 4.58 | 5.31 | 4.23 |
| 28.12.2024 | 4.62 | 5.82 | 4.24 |
| 27.12.2024 | 4.66 | 5.97 | 4.19 |
| 26.12.2024 | 4.69 | 5.18 | 4.23 |
| 25.12.2024 | 4.78 | 5.8 | 4.26 |
© Bayerisches Landesamt für Umwelt 2025