
- Start >
- Rivers >
- Discharge >
- Obere Donau >
- Oberding >
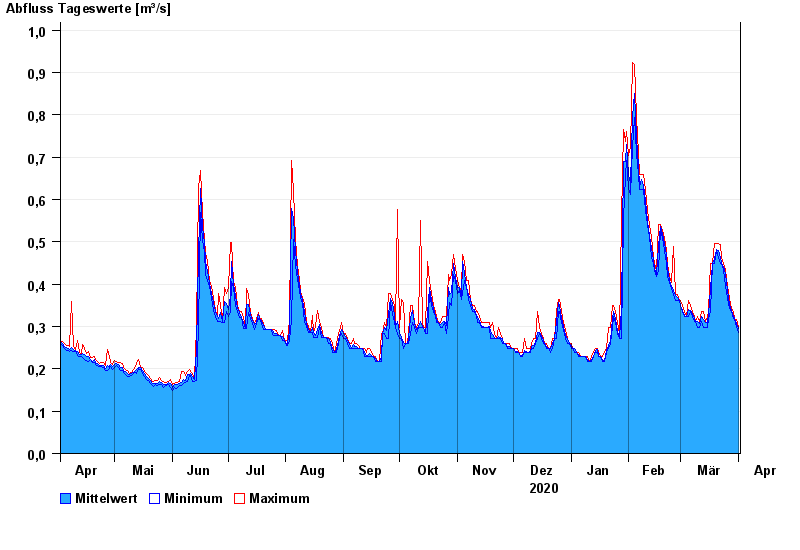
- Chart of year

Chart of year Oberding / Gfällach
Discharge from 02.04.2020 to 01.04.2021
- 03.06.2013 Abfluss: 6,03 m³/s
- 07.06.1995 Abfluss: 5,13 m³/s
- 18.06.1979 Abfluss: 3,73 m³/s
- 07.08.2002 Abfluss: 3,46 m³/s
- 17.11.1973 Abfluss: 3,27 m³/s
| Date | Mean value [m³/s] | Maximum [m³/s] | Minimum [m³/s] |
|---|---|---|---|
| 01.04.2021 | 0.295 | 0.3 | 0.286 |
| 31.03.2021 | 0.308 | 0.316 | 0.3 |
| 30.03.2021 | 0.318 | 0.32 | 0.316 |
| 29.03.2021 | 0.323 | 0.336 | 0.32 |
| 28.03.2021 | 0.339 | 0.343 | 0.336 |
| 27.03.2021 | 0.351 | 0.365 | 0.343 |
| 26.03.2021 | 0.384 | 0.395 | 0.365 |
© Bayerisches Landesamt für Umwelt 2024