
- Start >
- Rivers >
- Discharge >
- Obere Donau >
- Oberding >
- Chart of year

Chart of year Oberding / Gfällach
Discharge from 02.04.2019 to 01.04.2020
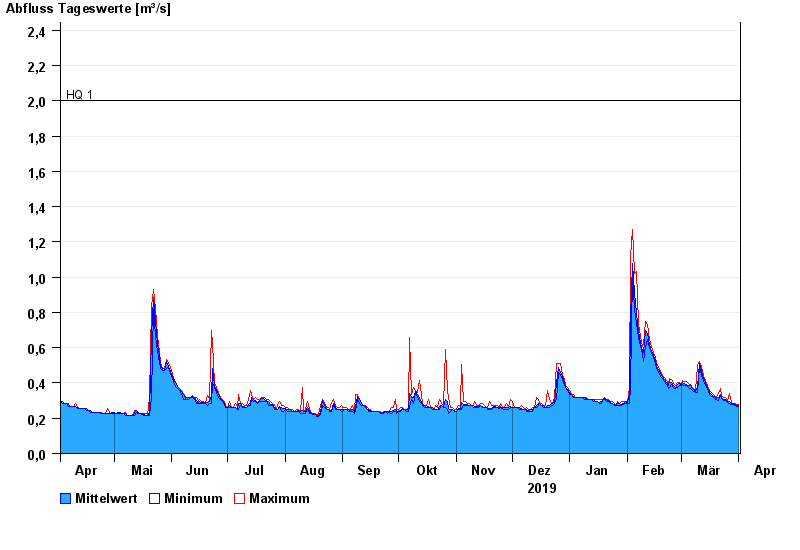
- HQ1 2 m³/s
- HQ2 2,5 m³/s
- HQ5 2,9 m³/s
- HQ10 3,4 m³/s
- HQ20 3,8 m³/s
- HQ50 4,4 m³/s
- HQ100 4,9 m³/s
| Date | Mean value [m³/s] | Maximum [m³/s] | Minimum [m³/s] |
|---|---|---|---|
| 01.04.2020 | 0.271 | 0.279 | 0.265 |
| 31.03.2020 | 0.273 | 0.277 | 0.268 |
| 30.03.2020 | 0.277 | 0.281 | 0.272 |
| 29.03.2020 | 0.281 | 0.284 | 0.279 |
| 28.03.2020 | 0.284 | 0.288 | 0.279 |
| 27.03.2020 | 0.292 | 0.341 | 0.286 |
| 26.03.2020 | 0.296 | 0.3 | 0.288 |
© Bayerisches Landesamt für Umwelt 2024