
- Start >
- Rivers >
- Discharge >
- Obere Donau >
- Oberding >
- Chart of year

Chart of year Oberding / Gfällach
Discharge from 01.01.2017 to 31.12.2017
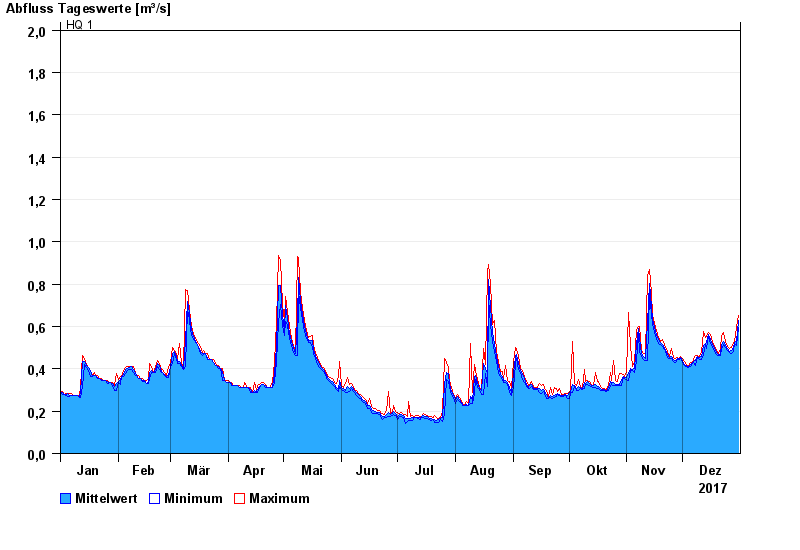
- HQ1 2 m³/s
- HQ2 2,5 m³/s
- HQ5 2,9 m³/s
- HQ10 3,4 m³/s
- HQ20 3,8 m³/s
- HQ50 4,4 m³/s
- HQ100 4,9 m³/s
| Date | Mean value [m³/s] | Maximum [m³/s] | Minimum [m³/s] |
|---|---|---|---|
| 31.12.2017 | 0.63 | 0.652 | 0.594 |
| 30.12.2017 | 0.531 | 0.594 | 0.511 |
| 29.12.2017 | 0.523 | 0.53 | 0.518 |
| 28.12.2017 | 0.5 | 0.524 | 0.484 |
| 27.12.2017 | 0.486 | 0.502 | 0.472 |
| 26.12.2017 | 0.483 | 0.494 | 0.475 |
| 25.12.2017 | 0.495 | 0.505 | 0.489 |
© Bayerisches Landesamt für Umwelt 2024