
- Start >
- Rivers >
- Discharge >
- Obere Donau >
- Oberding >
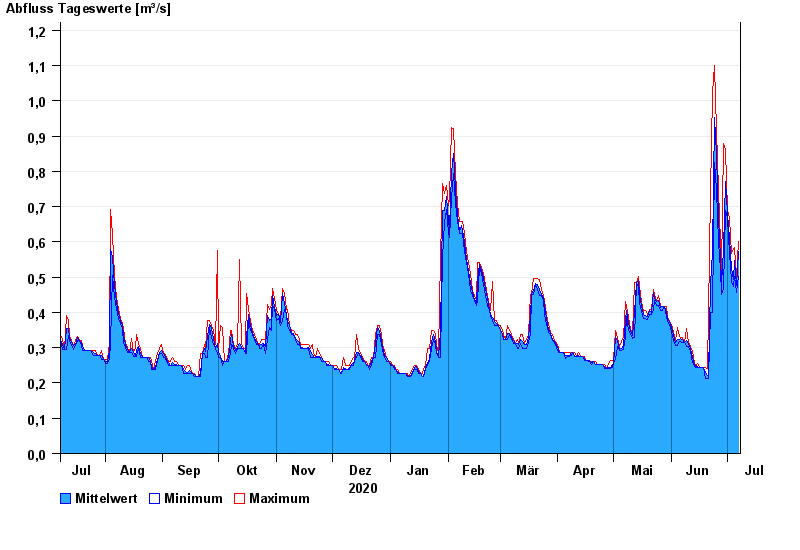
- Chart of year

Chart of year Oberding / Gfällach
Discharge from 08.07.2020 to 07.07.2021
| Date | Mean value [m³/s] | Maximum [m³/s] | Minimum [m³/s] |
|---|---|---|---|
| 07.07.2021 | 0.572 | 0.6 | 0.503 |
| 06.07.2021 | 0.476 | 0.503 | 0.457 |
| 05.07.2021 | 0.547 | 0.583 | 0.503 |
| 04.07.2021 | 0.494 | 0.577 | 0.473 |
| 03.07.2021 | 0.524 | 0.567 | 0.488 |
| 02.07.2021 | 0.61 | 0.667 | 0.567 |
| 01.07.2021 | 0.68 | 0.688 | 0.667 |
© Bayerisches Landesamt für Umwelt 2024