
- Start >
- Rivers >
- Discharge >
- Obere Donau >
- Oberding >
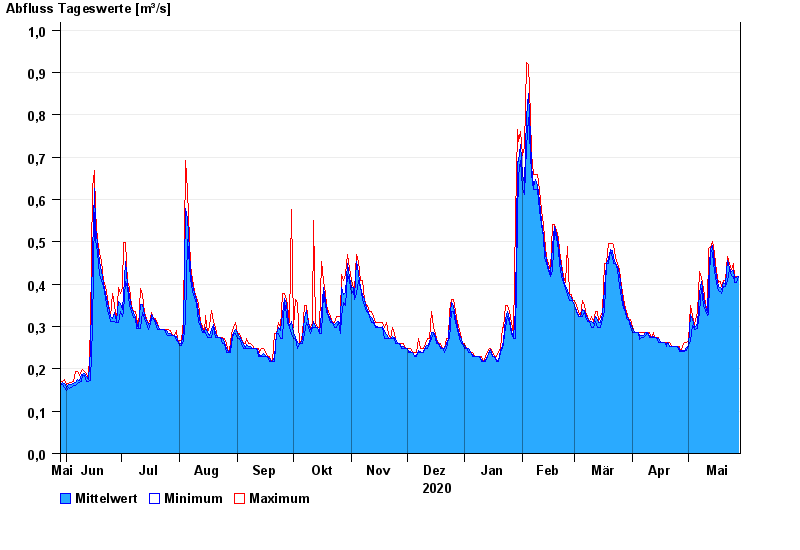
- Chart of year

Chart of year Oberding / Gfällach
Discharge from 29.05.2020 to 28.05.2021
- 03.06.2013 Abfluss: 6,03 m³/s
- 07.06.1995 Abfluss: 5,13 m³/s
- 18.06.1979 Abfluss: 3,73 m³/s
- 07.08.2002 Abfluss: 3,46 m³/s
- 17.11.1973 Abfluss: 3,27 m³/s
| Date | Mean value [m³/s] | Maximum [m³/s] | Minimum [m³/s] |
|---|---|---|---|
| 28.05.2021 | 0.417 | 0.417 | 0.417 |
| 27.05.2021 | 0.416 | 0.418 | 0.404 |
| 26.05.2021 | 0.414 | 0.419 | 0.404 |
| 25.05.2021 | 0.433 | 0.449 | 0.419 |
| 24.05.2021 | 0.43 | 0.435 | 0.42 |
| 23.05.2021 | 0.438 | 0.45 | 0.435 |
| 22.05.2021 | 0.456 | 0.466 | 0.408 |
© Bayerisches Landesamt für Umwelt 2024