
- Start >
- Rivers >
- Discharge >
- Obere Donau >
- Oberding >
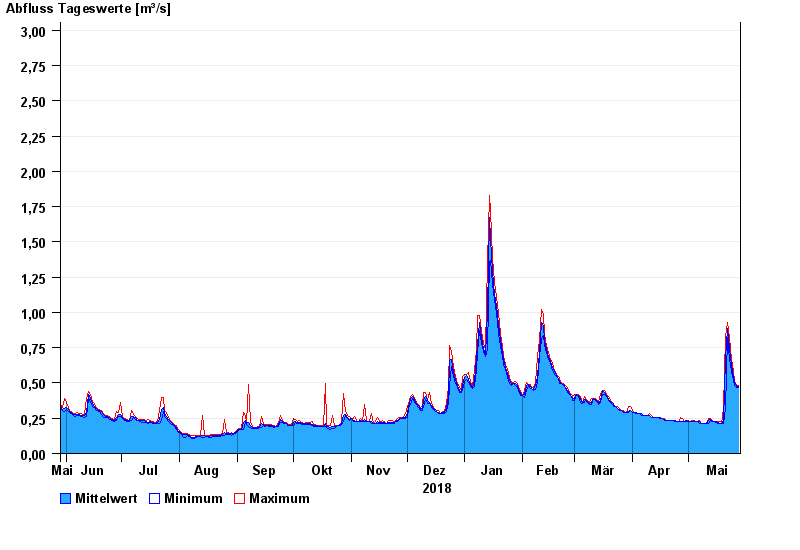
- Chart of year

Chart of year Oberding / Gfällach
Discharge from 29.05.2018 to 28.05.2019
- 03.06.2013 Abfluss: 6,03 m³/s
- 07.06.1995 Abfluss: 5,13 m³/s
- 18.06.1979 Abfluss: 3,73 m³/s
- 07.08.2002 Abfluss: 3,46 m³/s
- 17.11.1973 Abfluss: 3,27 m³/s
| Date | Mean value [m³/s] | Maximum [m³/s] | Minimum [m³/s] |
|---|---|---|---|
| 28.05.2019 | 0.472 | 0.484 | 0.469 |
| 27.05.2019 | 0.477 | 0.484 | 0.469 |
| 26.05.2019 | 0.503 | 0.515 | 0.484 |
| 25.05.2019 | 0.549 | 0.579 | 0.515 |
| 24.05.2019 | 0.621 | 0.663 | 0.579 |
| 23.05.2019 | 0.747 | 0.82 | 0.663 |
| 22.05.2019 | 0.885 | 0.93 | 0.82 |
© Bayerisches Landesamt für Umwelt 2024