
- Start >
- Rivers >
- Discharge >
- Obere Donau >
- Oberding >
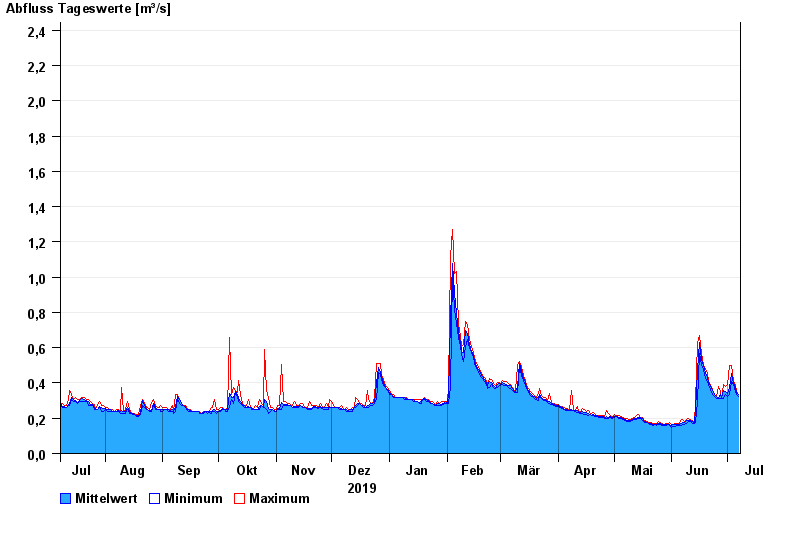
- Chart of year

Chart of year Oberding / Gfällach
Discharge from 08.07.2019 to 07.07.2020
- 03.06.2013 Abfluss: 6,03 m³/s
- 07.06.1995 Abfluss: 5,13 m³/s
- 18.06.1979 Abfluss: 3,73 m³/s
- 07.08.2002 Abfluss: 3,46 m³/s
- 17.11.1973 Abfluss: 3,27 m³/s
| Date | Mean value [m³/s] | Maximum [m³/s] | Minimum [m³/s] |
|---|---|---|---|
| 07.07.2020 | 0.332 | 0.335 | 0.322 |
| 06.07.2020 | 0.346 | 0.349 | 0.335 |
| 05.07.2020 | 0.372 | 0.392 | 0.349 |
| 04.07.2020 | 0.399 | 0.407 | 0.392 |
| 03.07.2020 | 0.453 | 0.499 | 0.407 |
| 02.07.2020 | 0.374 | 0.499 | 0.336 |
| 01.07.2020 | 0.341 | 0.392 | 0.323 |
© Bayerisches Landesamt für Umwelt 2024