
- Start >
- Rivers >
- Discharge >
- Obere Donau >
- Oberding >
- Chart of year

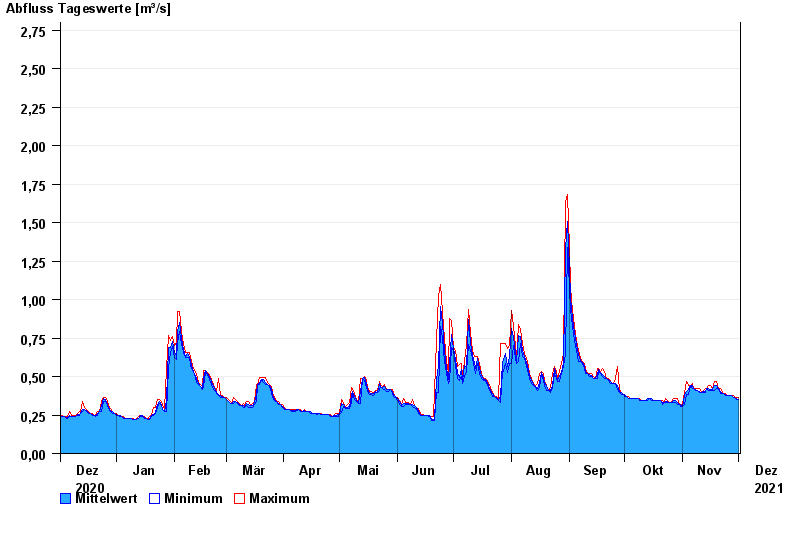
Chart of year Oberding / Gfällach
Discharge from 02.12.2020 to 01.12.2021
- 03.06.2013 Abfluss: 6,03 m³/s
- 07.06.1995 Abfluss: 5,13 m³/s
- 18.06.1979 Abfluss: 3,73 m³/s
- 07.08.2002 Abfluss: 3,46 m³/s
- 17.11.1973 Abfluss: 3,27 m³/s
| Date | Mean value [m³/s] | Maximum [m³/s] | Minimum [m³/s] |
|---|---|---|---|
| 01.12.2021 | 0.351 | 0.363 | 0.35 |
| 30.11.2021 | 0.359 | 0.364 | 0.351 |
| 29.11.2021 | 0.364 | 0.364 | 0.364 |
| 28.11.2021 | 0.366 | 0.378 | 0.364 |
| 27.11.2021 | 0.378 | 0.378 | 0.378 |
| 26.11.2021 | 0.378 | 0.379 | 0.378 |
| 25.11.2021 | 0.379 | 0.379 | 0.379 |
© Bayerisches Landesamt für Umwelt 2024