
- Start >
- Rivers >
- Discharge >
- Obere Donau >
- Oberding >
- Chart of year

Chart of year Oberding / Gfällach
Discharge from 31.05.2020 to 30.05.2021
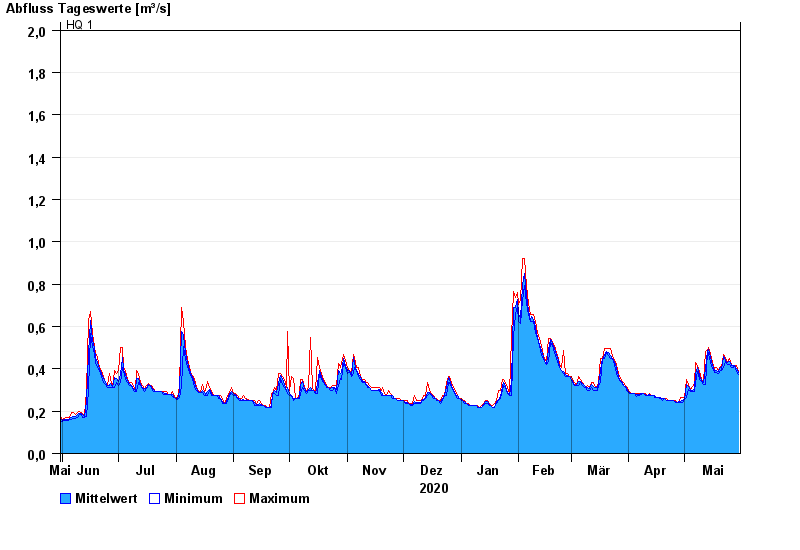
- HQ1 2 m³/s
- HQ2 2,5 m³/s
- HQ5 2,9 m³/s
- HQ10 3,4 m³/s
- HQ20 3,8 m³/s
- HQ50 4,4 m³/s
- HQ100 4,9 m³/s
| Date | Mean value [m³/s] | Maximum [m³/s] | Minimum [m³/s] |
|---|---|---|---|
| 30.05.2021 | 0.384 | 0.388 | 0.373 |
| 29.05.2021 | 0.4 | 0.417 | 0.388 |
| 28.05.2021 | 0.417 | 0.417 | 0.417 |
| 27.05.2021 | 0.416 | 0.418 | 0.404 |
| 26.05.2021 | 0.414 | 0.419 | 0.404 |
| 25.05.2021 | 0.433 | 0.449 | 0.419 |
| 24.05.2021 | 0.43 | 0.435 | 0.42 |
© Bayerisches Landesamt für Umwelt 2024