
- Start >
- Rivers >
- Discharge >
- Obere Donau >
- Oberding >
- Chart of year

Chart of year Oberding / Gfällach
Discharge from 29.05.2021 to 28.05.2022
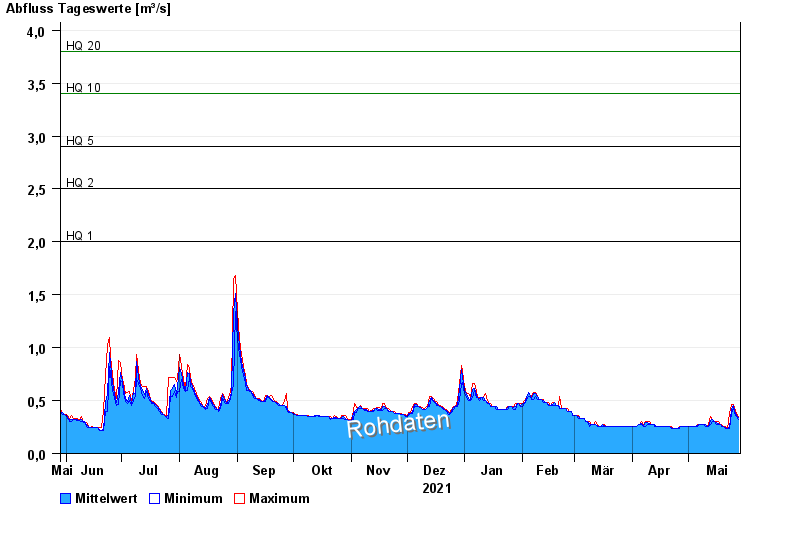
- HQ1 2 m³/s
- HQ2 2,5 m³/s
- HQ5 2,9 m³/s
- HQ10 3,4 m³/s
- HQ20 3,8 m³/s
- HQ50 4,4 m³/s
- HQ100 4,9 m³/s
| Date | Mean value [m³/s] | Maximum [m³/s] | Minimum [m³/s] |
|---|---|---|---|
| 28.05.2022 | 0.336 | 0.351 | 0.325 |
| 27.05.2022 | 0.36 | 0.377 | 0.351 |
| 26.05.2022 | 0.405 | 0.435 | 0.377 |
| 25.05.2022 | 0.453 | 0.465 | 0.435 |
| 24.05.2022 | 0.42 | 0.465 | 0.377 |
| 23.05.2022 | 0.247 | 0.377 | 0.236 |
| 22.05.2022 | 0.236 | 0.236 | 0.236 |
© Bayerisches Landesamt für Umwelt 2024