
- Start >
- Rivers >
- Discharge >
- Obere Donau >
- Nürnberg Lederersteg >
- Chart of year

Chart of year Nürnberg Lederersteg / Pegnitz
Discharge from 01.01.2020 to 31.12.2020
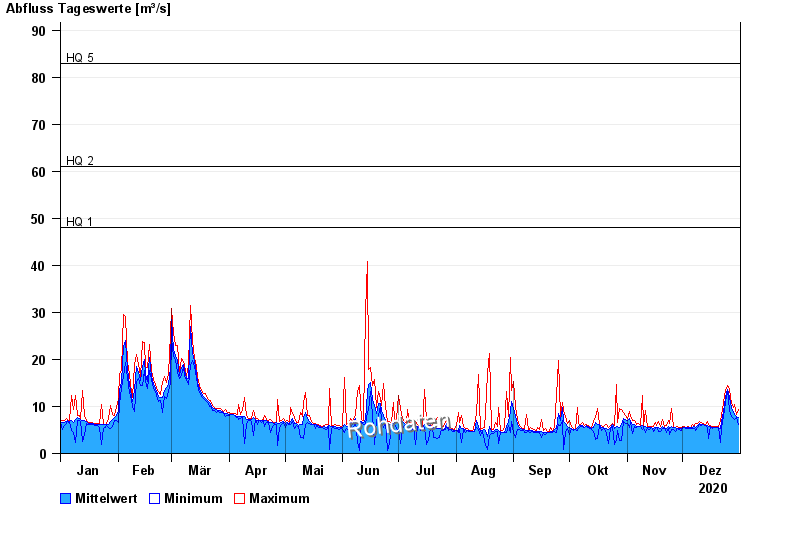
- HQ1 48 m³/s
- HQ2 61 m³/s
- HQ5 83 m³/s
- HQ10 120 m³/s
- HQ20 154 m³/s
- HQ50 202 m³/s
- HQ100 240 m³/s
| Date | Mean value [m³/s] | Maximum [m³/s] | Minimum [m³/s] |
|---|---|---|---|
| 31.12.2020 | 7.63 | 9.27 | 6.22 |
| 30.12.2020 | 7.92 | 8.19 | 7.67 |
| 29.12.2020 | 8.19 | 10.4 | 7.16 |
| 28.12.2020 | 8.75 | 9.79 | 7.4 |
| 27.12.2020 | 9.74 | 10.6 | 7.91 |
| 26.12.2020 | 11.9 | 13.6 | 9.23 |
| 25.12.2020 | 13.6 | 14.5 | 13.3 |
© Bayerisches Landesamt für Umwelt 2024