
- Start >
- Rivers >
- Discharge >
- Obere Donau >
- Nürnberg Lederersteg >
- Chart of year

Chart of year Nürnberg Lederersteg / Pegnitz
Discharge from 01.01.2024 to 04.05.2024
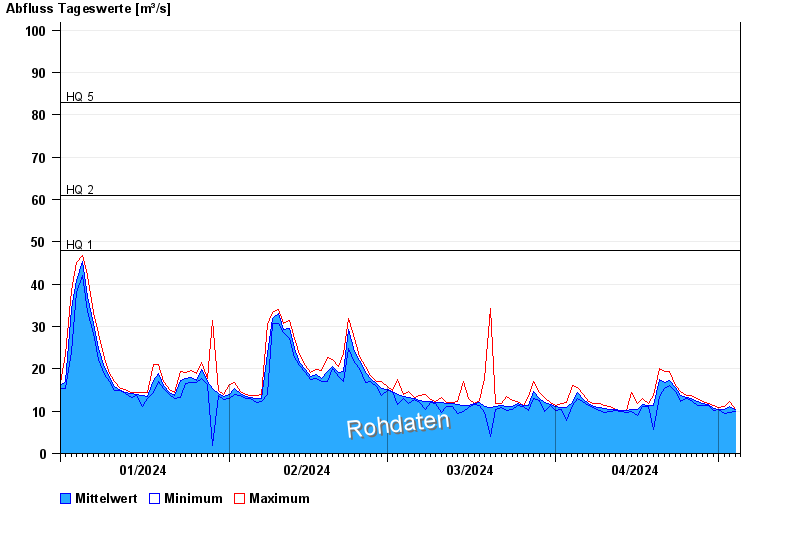
- HQ1 48 m³/s
- HQ2 61 m³/s
- HQ5 83 m³/s
- HQ10 120 m³/s
- HQ20 154 m³/s
- HQ50 202 m³/s
- HQ100 240 m³/s
| Date | Mean value [m³/s] | Maximum [m³/s] | Minimum [m³/s] |
|---|---|---|---|
| 04.05.2024 | 10.4 | 10.5 | 9.96 |
| 03.05.2024 | 11.1 | 12.3 | 9.68 |
| 02.05.2024 | 10.3 | 11.1 | 9.45 |
| 01.05.2024 | 10.5 | 10.8 | 10.5 |
| 30.04.2024 | 10.7 | 11.4 | 10.2 |
| 29.04.2024 | 11.5 | 11.7 | 11.4 |
| 28.04.2024 | 11.8 | 12.3 | 11.4 |
© Bayerisches Landesamt für Umwelt 2024