
- Start >
- Rivers >
- Discharge >
- Obere Donau >
- Neu Ulm, Bad Held >
- Chart of year

Chart of year Neu Ulm, Bad Held / Donau
Discharge from 30.10.2022 to 29.10.2023
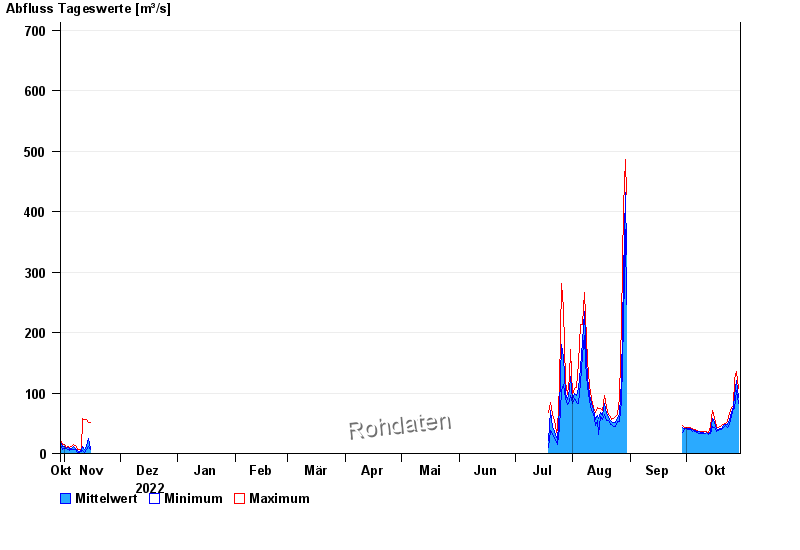
ACHTUNG!
Pegel durch außerordentlichen Kraftwerksbetrieb beeinflusst.
- 29.12.1882 Abfluss: 1250 m³/s
- 02.02.1862 Abfluss: 1140 m³/s
- 13.06.1876 Abfluss: 1050 m³/s
- 23.05.1999 Abfluss: 1020 m³/s
- 24.08.2005 Abfluss: 975 m³/s
| Date | Mean value [m³/s] | Maximum [m³/s] | Minimum [m³/s] |
|---|---|---|---|
| 29.10.2023 | 92.9 | 107 | 82.4 |
| 28.10.2023 | 120 | 136 | 104 |
| 27.10.2023 | 96.5 | 124 | 73.7 |
| 26.10.2023 | 77 | 79.6 | 75.2 |
| 25.10.2023 | 68 | 76.5 | 61.5 |
| 24.10.2023 | 54.9 | 66.9 | 47.9 |
| 23.10.2023 | 47.5 | 52.7 | 42.3 |
© Bayerisches Landesamt für Umwelt 2024