
- Start >
- Rivers >
- Discharge >
- Obere Donau >
- Neu Ulm, Bad Held >
- Chart of year

Chart of year Neu Ulm, Bad Held / Donau
Discharge from 23.02.2019 to 22.02.2020
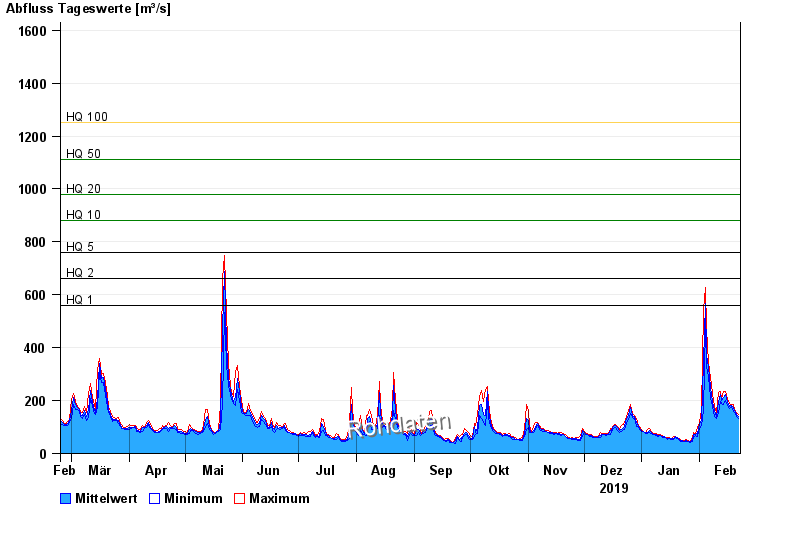
ACHTUNG!
Pegel durch außerordentlichen Kraftwerksbetrieb beeinflusst.
- HQ1 560 m³/s
- HQ2 660 m³/s
- HQ5 760 m³/s
- HQ10 880 m³/s
- HQ20 980 m³/s
- HQ50 1110 m³/s
- HQ100 1250 m³/s
| Date | Mean value [m³/s] | Maximum [m³/s] | Minimum [m³/s] |
|---|---|---|---|
| 22.02.2020 | 141 | 149 | 131 |
| 21.02.2020 | 148 | 155 | 141 |
| 20.02.2020 | 161 | 168 | 155 |
| 19.02.2020 | 174 | 185 | 160 |
| 18.02.2020 | 182 | 185 | 179 |
| 17.02.2020 | 179 | 189 | 170 |
| 16.02.2020 | 194 | 207 | 181 |
© Bayerisches Landesamt für Umwelt 2024