
- Start >
- Rivers >
- Discharge >
- Obere Donau >
- Nattenhausen >
- Chart of year

Chart of year Nattenhausen / Günz
Discharge from 06.08.2021 to 05.08.2022
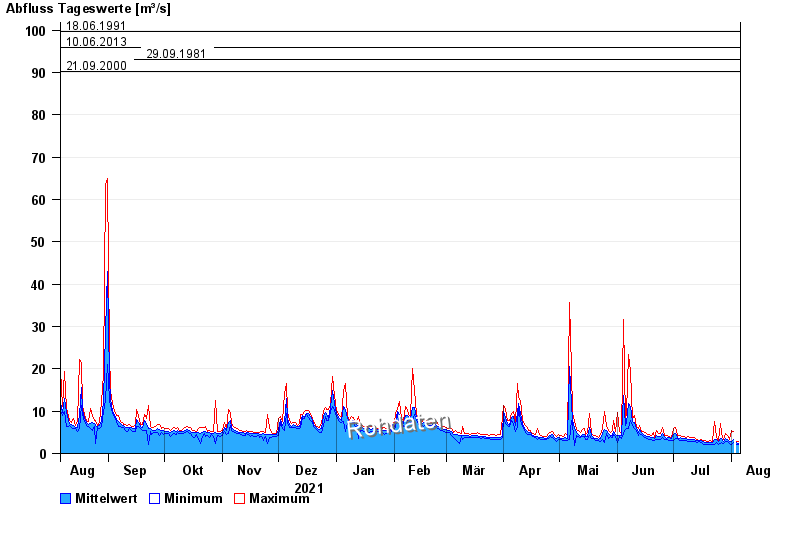
- 12.08.2002 Abfluss: 104 m³/s
- 18.06.1991 Abfluss: 99,6 m³/s
- 10.06.2013 Abfluss: 96 m³/s
- 29.09.1981 Abfluss: 93 m³/s
- 21.09.2000 Abfluss: 90,3 m³/s
| Date | Mean value [m³/s] | Maximum [m³/s] | Minimum [m³/s] |
|---|---|---|---|
| 05.08.2022 | 2.4 | 2.94 | 2.05 |
| 04.08.2022 | 2.54 | 2.94 | 2.21 |
| 03.08.2022 | -- | -- | -- |
| 02.08.2022 | 3.28 | 5.28 | 2.56 |
| 01.08.2022 | 2.78 | 5.55 | 2.21 |
| 31.07.2022 | 2.81 | 3.35 | 2.38 |
| 30.07.2022 | 3.37 | 4.26 | 2.74 |
© Bayerisches Landesamt für Umwelt 2024