
- Start >
- Rivers >
- Discharge >
- Obere Donau >
- Nattenhausen >
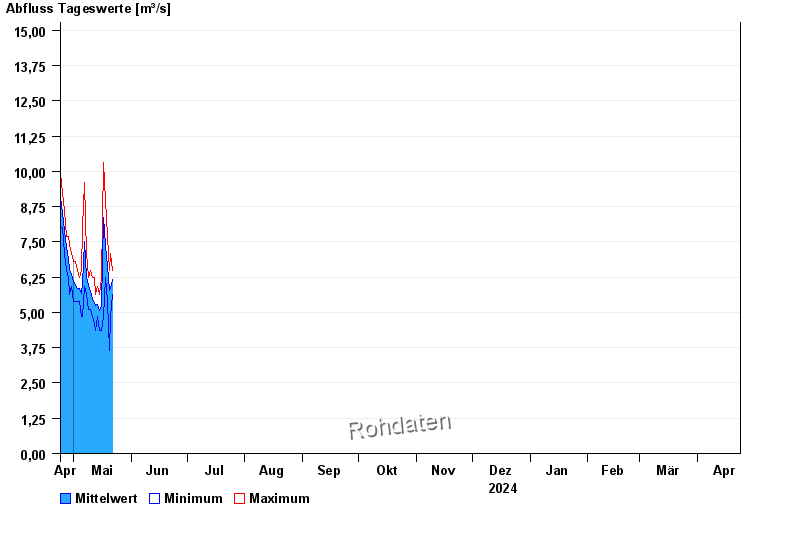
- Chart of year

Chart of year Nattenhausen / Günz
Discharge from 24.04.2024 to 23.04.2025
- 12.08.2002 Abfluss: 104 m³/s
- 18.06.1991 Abfluss: 99,6 m³/s
- 10.06.2013 Abfluss: 96 m³/s
- 29.09.1981 Abfluss: 93 m³/s
- 21.09.2000 Abfluss: 90,3 m³/s
| Date | Mean value [m³/s] | Maximum [m³/s] | Minimum [m³/s] |
|---|---|---|---|
| 03.05.2024 | 5.83 | 6.5 | 5.39 |
| 02.05.2024 | 5.94 | 6.79 | 5.39 |
| 01.05.2024 | 6.11 | 6.79 | 5.39 |
| 30.04.2024 | 6.34 | 7.09 | 5.93 |
| 29.04.2024 | 6.51 | 7.39 | 5.65 |
| 28.04.2024 | 6.89 | 7.69 | 6.22 |
| 27.04.2024 | 7.29 | 7.69 | 6.5 |
© Bayerisches Landesamt für Umwelt 2024