
- Start >
- Rivers >
- Discharge >
- Obere Donau >
- Mühlried >
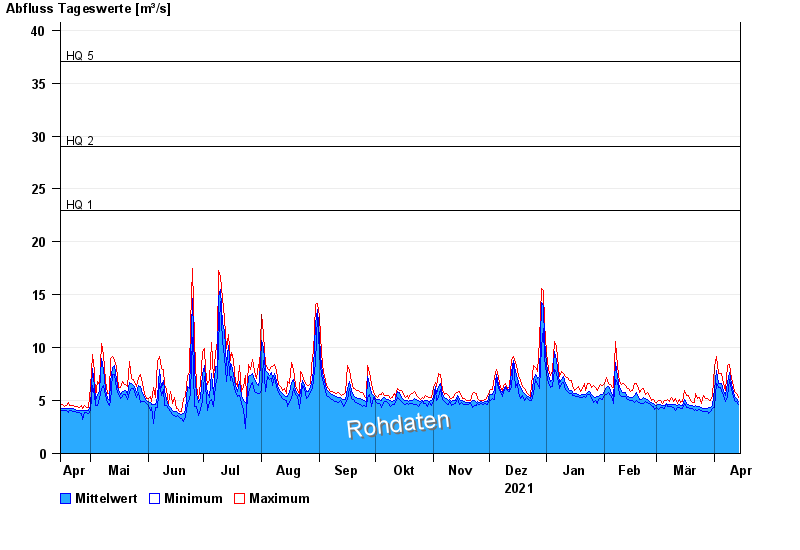
- Chart of year

Chart of year Mühlried / Paar
Discharge from 15.04.2021 to 14.04.2022
note
Geber 2 Defekt
- HQ1 23 m³/s
- HQ2 29 m³/s
- HQ5 37 m³/s
- HQ10 44 m³/s
- HQ20 51 m³/s
- HQ50 63 m³/s
- HQ100 72,3 m³/s
| Date | Mean value [m³/s] | Maximum [m³/s] | Minimum [m³/s] |
|---|---|---|---|
| 14.04.2022 | 4.94 | 5.3 | 4.59 |
| 13.04.2022 | 5.17 | 5.68 | 4.93 |
| 12.04.2022 | 5.39 | 5.87 | 5.03 |
| 11.04.2022 | 5.75 | 6.36 | 5.39 |
| 10.04.2022 | 6.65 | 7.07 | 6.07 |
| 09.04.2022 | 7.61 | 8.39 | 6.96 |
| 08.04.2022 | 6.75 | 8.29 | 5.39 |
© Bayerisches Landesamt für Umwelt 2024