
- Start >
- Rivers >
- Discharge >
- Obere Donau >
- Mühlried >
- Chart of year

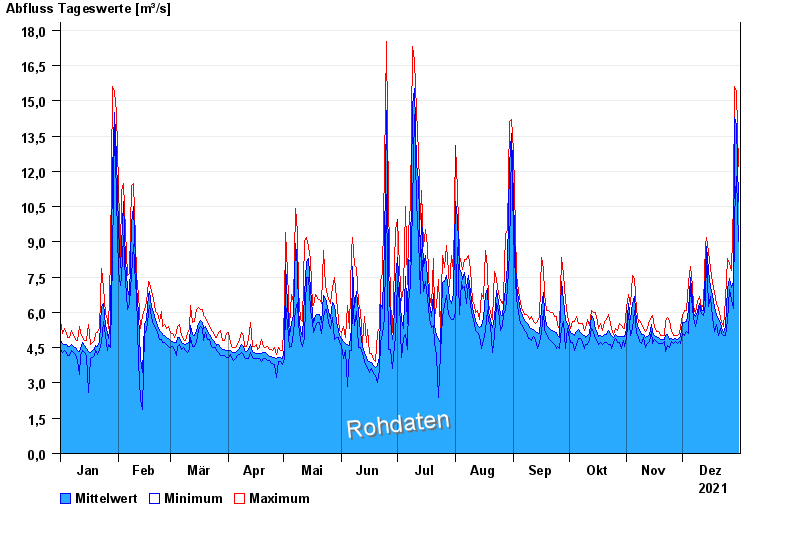
Chart of year Mühlried / Paar
Discharge from 01.01.2021 to 31.12.2021
| Date | Mean value [m³/s] | Maximum [m³/s] | Minimum [m³/s] |
|---|---|---|---|
| 31.12.2021 | 10.7 | 12.2 | 9 |
| 30.12.2021 | 14 | 15.4 | 11.8 |
| 29.12.2021 | 14.3 | 15.6 | 10.1 |
| 28.12.2021 | 7.32 | 10.7 | 6.16 |
| 27.12.2021 | 7.08 | 7.77 | 6.55 |
| 26.12.2021 | 7.46 | 8.08 | 6.96 |
| 25.12.2021 | 7.03 | 8.28 | 5.67 |
© Bayerisches Landesamt für Umwelt 2024