
- Start >
- Rivers >
- Discharge >
- Obere Donau >
- Mühlbach >
- Chart of year

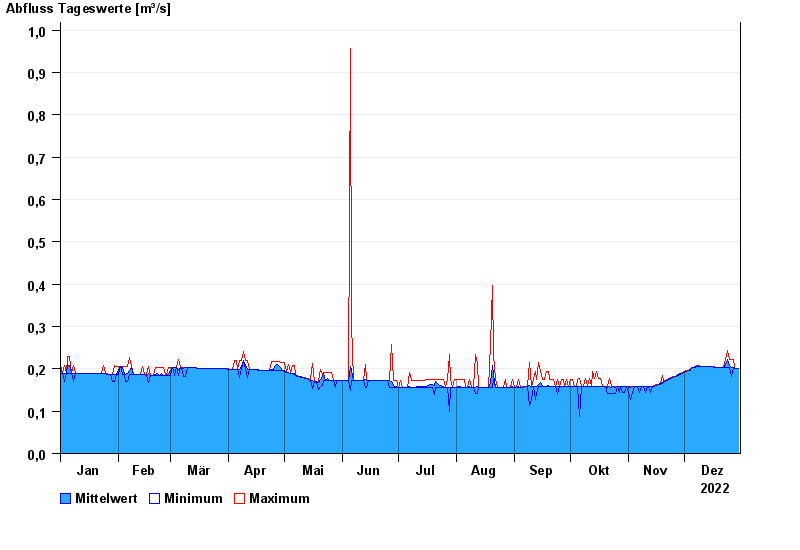
Chart of year Mühlbach / Mühlbach
Discharge from 01.01.2022 to 30.12.2022
 Für diesen Pegel sind keine Hauptwerte hinterlegt.
| Date | Mean value [m³/s] | Maximum [m³/s] | Minimum [m³/s] |
|---|---|---|---|
| 30.12.2022 | 0.201 | 0.201 | 0.201 |
| 29.12.2022 | 0.201 | 0.201 | 0.201 |
| 28.12.2022 | 0.202 | 0.202 | 0.201 |
| 27.12.2022 | 0.202 | 0.222 | 0.202 |
| 26.12.2022 | 0.202 | 0.222 | 0.183 |
| 25.12.2022 | 0.208 | 0.223 | 0.202 |
| 24.12.2022 | 0.223 | 0.244 | 0.203 |
© Bayerisches Landesamt für Umwelt 2024