
- Start >
- Rivers >
- Discharge >
- Obere Donau >
- Moosburg >
- Chart of year

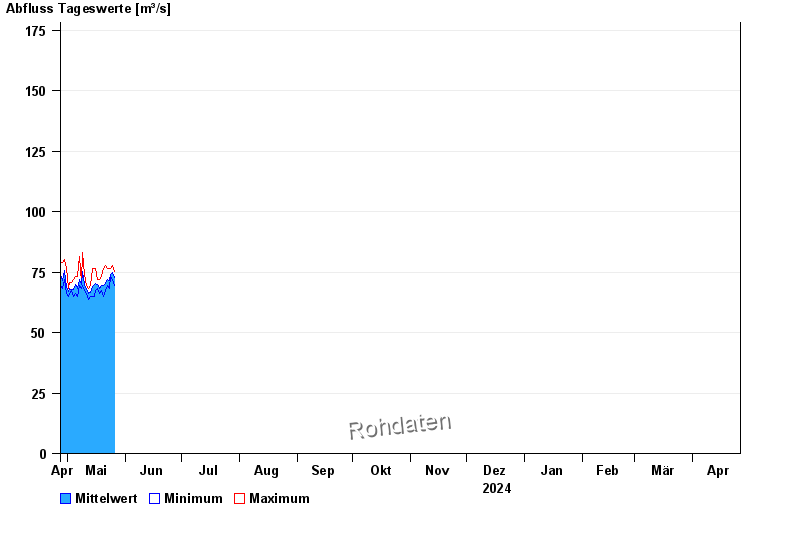
Chart of year Moosburg / Isar
Discharge from 27.04.2024 to 26.04.2025
 Für diesen Pegel sind keine Jährlichkeiten hinterlegt.
| Date | Mean value [m³/s] | Maximum [m³/s] | Minimum [m³/s] |
|---|---|---|---|
| 19.05.2024 | 69 | 71.8 | 67.2 |
| 18.05.2024 | 68.3 | 71.8 | 66 |
| 17.05.2024 | 70 | 71.8 | 68.3 |
| 16.05.2024 | 70.2 | 76.6 | 67.2 |
| 15.05.2024 | 69.7 | 76.6 | 64.9 |
| 14.05.2024 | 69.2 | 76.6 | 64.9 |
| 13.05.2024 | 66.7 | 69.5 | 64.9 |
© Bayerisches Landesamt für Umwelt 2024