
- Start >
- Rivers >
- Discharge >
- Obere Donau >
- Moosburg >
- Chart of month

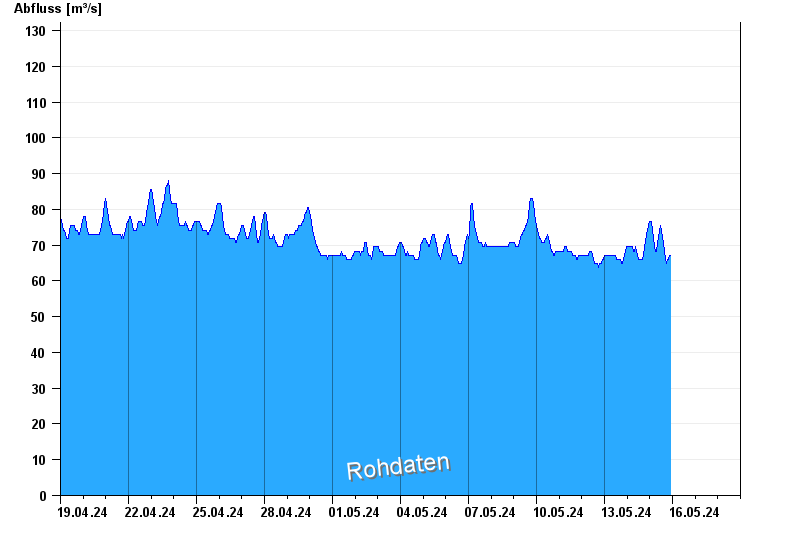
Chart of month Moosburg / Isar
Discharge from 19.04.2024 to 18.05.2024
- Abfluss: m³/s
- Abfluss: m³/s
- Abfluss: m³/s
- Abfluss: m³/s
- Abfluss: m³/s
| Date | Runoff [m³/s] |
|---|---|
| 19.05.2024 00:45 | 69.5 |
| 19.05.2024 00:30 | 69.5 |
| 19.05.2024 00:15 | 69.5 |
| 19.05.2024 00:00 | 68.3 |
| 18.05.2024 23:45 | 68.3 |
| 18.05.2024 23:30 | 67.2 |
| 18.05.2024 23:15 | 67.2 |
© Bayerisches Landesamt für Umwelt 2024