
- Start >
- Rivers >
- Discharge >
- Obere Donau >
- Manching (Ort) >
- Chart of year

Chart of year Manching (Ort) / Paar
Discharge from 27.07.2021 to 26.07.2022
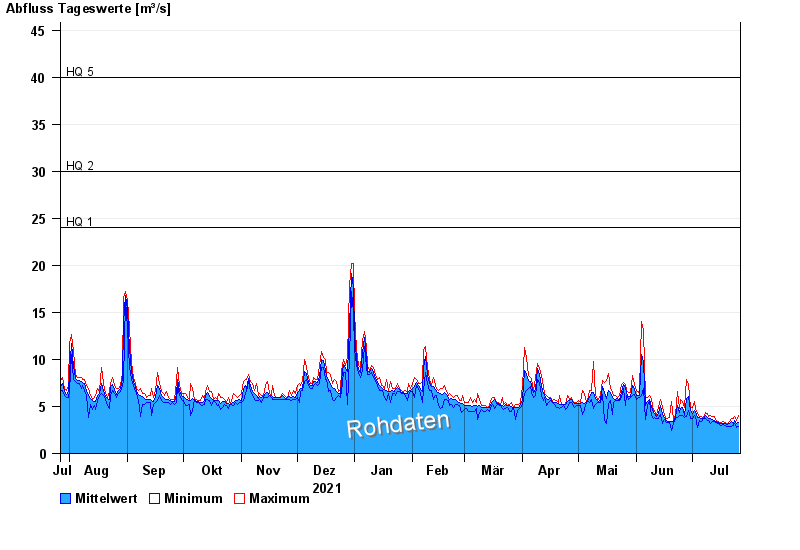
- HQ1 24 m³/s
- HQ2 30 m³/s
- HQ5 40 m³/s
- HQ10 49 m³/s
- HQ20 60 m³/s
- HQ50 77 m³/s
- HQ100 92 m³/s
| Date | Mean value [m³/s] | Maximum [m³/s] | Minimum [m³/s] |
|---|---|---|---|
| 26.07.2022 | 3.26 | 4.09 | 2.88 |
| 25.07.2022 | 3.23 | 3.56 | 2.77 |
| 24.07.2022 | 3.55 | 3.96 | 3.19 |
| 23.07.2022 | 3.2 | 3.69 | 2.97 |
| 22.07.2022 | 3.38 | 3.69 | 2.88 |
| 21.07.2022 | 3.15 | 3.43 | 2.88 |
| 20.07.2022 | 3.09 | 3.19 | 2.88 |
© Bayerisches Landesamt für Umwelt 2024