
- Start >
- Rivers >
- Discharge >
- Obere Donau >
- Manching (Ort) >
- Chart of year

Chart of year Manching (Ort) / Paar
Discharge from 18.11.2019 to 17.11.2020
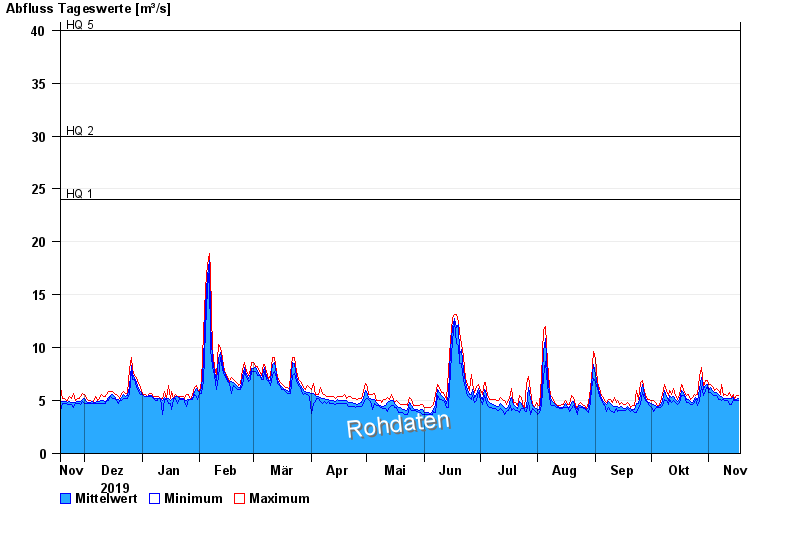
- HQ1 24 m³/s
- HQ2 30 m³/s
- HQ5 40 m³/s
- HQ10 49 m³/s
- HQ20 60 m³/s
- HQ50 77 m³/s
- HQ100 92 m³/s
| Date | Mean value [m³/s] | Maximum [m³/s] | Minimum [m³/s] |
|---|---|---|---|
| 17.11.2020 | 5.24 | 5.45 | 4.98 |
| 16.11.2020 | 5.08 | 5.45 | 4.98 |
| 15.11.2020 | 5.01 | 5.13 | 4.98 |
| 14.11.2020 | 5.28 | 5.62 | 5.13 |
| 13.11.2020 | 5.16 | 5.29 | 4.67 |
| 12.11.2020 | 5.21 | 5.79 | 4.67 |
| 11.11.2020 | 5.2 | 5.45 | 4.98 |
© Bayerisches Landesamt für Umwelt 2024