
- Start >
- Rivers >
- Discharge >
- Obere Donau >
- Manching (Ort) >
- Chart of year

Chart of year Manching (Ort) / Paar
Discharge from 07.06.2021 to 06.06.2022
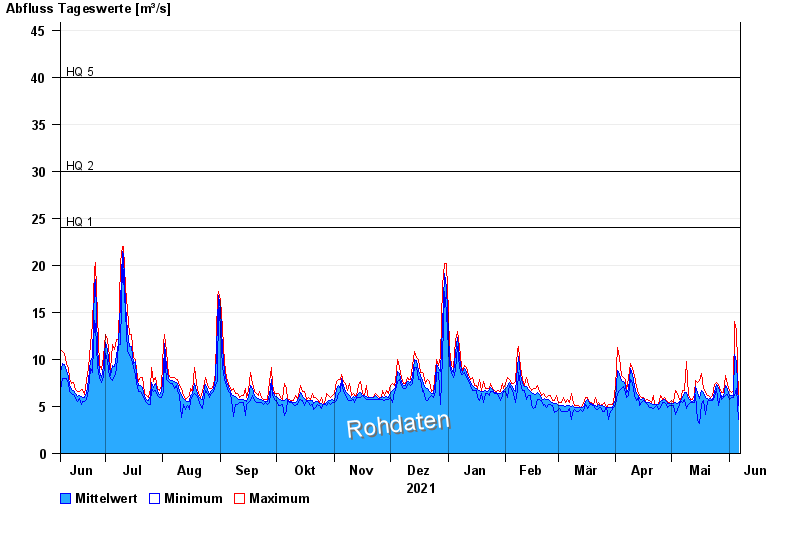
- HQ1 24 m³/s
- HQ2 30 m³/s
- HQ5 40 m³/s
- HQ10 49 m³/s
- HQ20 60 m³/s
- HQ50 77 m³/s
- HQ100 92 m³/s
| Date | Mean value [m³/s] | Maximum [m³/s] | Minimum [m³/s] |
|---|---|---|---|
| 06.06.2022 | 5.13 | 5.95 | 3.57 |
| 05.06.2022 | 9.65 | 13.1 | 6.92 |
| 04.06.2022 | 10.5 | 14 | 6.13 |
| 03.06.2022 | 6.13 | 6.71 | 5.94 |
| 02.06.2022 | 6.17 | 6.51 | 5.94 |
| 01.06.2022 | 6.14 | 6.71 | 5.76 |
| 31.05.2022 | 6.8 | 7.34 | 6.32 |
© Bayerisches Landesamt für Umwelt 2024