
- Start >
- Rivers >
- Discharge >
- Obere Donau >
- Manching (Ort) >
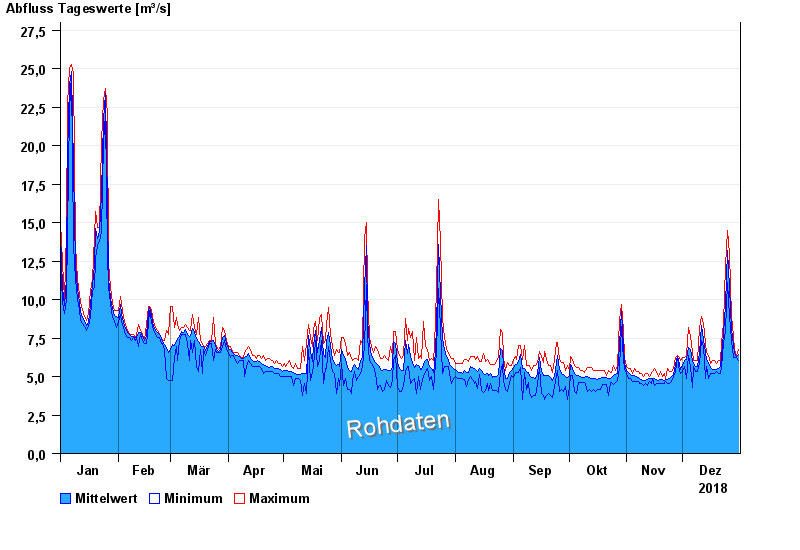
- Chart of year

Chart of year Manching (Ort) / Paar
Discharge from 01.01.2018 to 31.12.2018
| Date | Mean value [m³/s] | Maximum [m³/s] | Minimum [m³/s] |
|---|---|---|---|
| 31.12.2018 | 6.4 | 6.77 | 6.03 |
| 30.12.2018 | 6.3 | 6.39 | 6.21 |
| 29.12.2018 | 6.51 | 6.77 | 6.21 |
| 28.12.2018 | 7.03 | 7.57 | 6.21 |
| 27.12.2018 | 8.06 | 8.87 | 7.36 |
| 26.12.2018 | 10.8 | 13 | 8.87 |
| 25.12.2018 | 13.2 | 14.5 | 11.1 |
© Bayerisches Landesamt für Umwelt 2024