
- Start >
- Rivers >
- Discharge >
- Obere Donau >
- Manching (Ort) >
- Chart of year

Chart of year Manching (Ort) / Paar
Discharge from 01.01.2024 to 31.12.2024
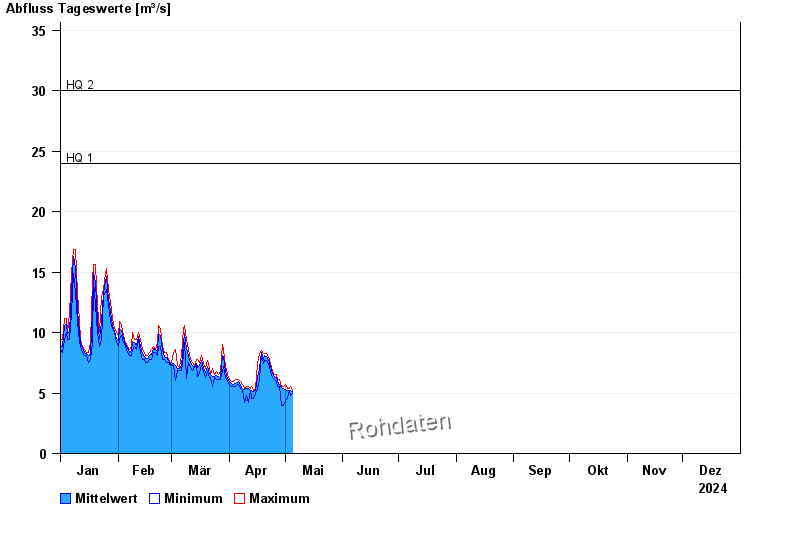
- HQ1 24 m³/s
- HQ2 30 m³/s
- HQ5 40 m³/s
- HQ10 49 m³/s
- HQ20 60 m³/s
- HQ50 77 m³/s
- HQ100 92 m³/s
| Date | Mean value [m³/s] | Maximum [m³/s] | Minimum [m³/s] |
|---|---|---|---|
| 23.05.2024 | 6.02 | 6.12 | 5.72 |
| 22.05.2024 | 5.73 | 6.12 | 4.99 |
| 21.05.2024 | 5.19 | 5.35 | 4.83 |
| 20.05.2024 | 5.76 | 5.93 | 4.83 |
| 19.05.2024 | 5.78 | 6.12 | 4.68 |
| 18.05.2024 | 5.69 | 5.72 | 5.54 |
| 17.05.2024 | 5.69 | 6.32 | 3.82 |
© Bayerisches Landesamt für Umwelt 2024