
- Start >
- Rivers >
- Discharge >
- Obere Donau >
- Mainburg >
- Chart of total period

Chart of total period Mainburg / Abens
Discharge from 01.11.1967 to 26.04.2024
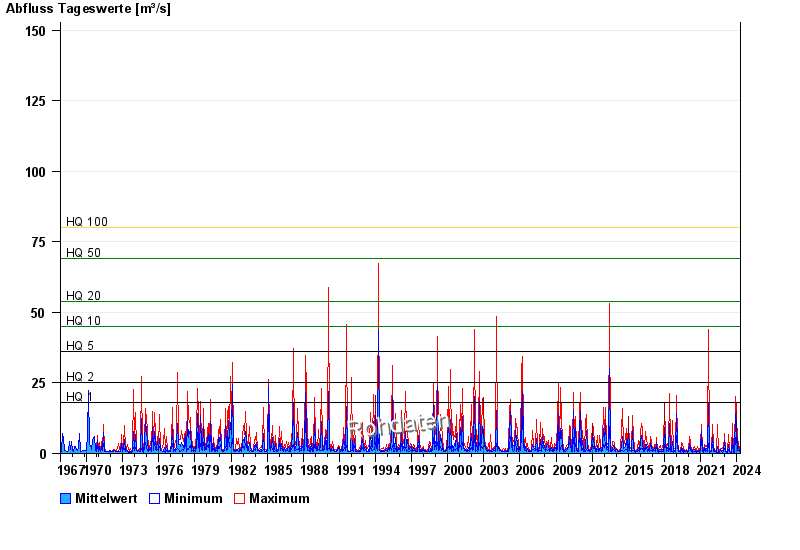
- HQ1 18 m³/s
- HQ2 25 m³/s
- HQ5 36 m³/s
- HQ10 45 m³/s
- HQ20 54 m³/s
- HQ50 69 m³/s
- HQ100 80 m³/s
| Date | Mean value [m³/s] | Maximum [m³/s] | Minimum [m³/s] |
|---|---|---|---|
| 26.04.2024 | 0.563 | 0.595 | 0.553 |
| 25.04.2024 | 0.606 | 0.642 | 0.595 |
| 24.04.2024 | 0.622 | 0.69 | 0.595 |
| 23.04.2024 | 0.714 | 0.844 | 0.642 |
| 22.04.2024 | 1.18 | 1.64 | 0.844 |
| 21.04.2024 | 0.794 | 1.39 | 0.553 |
| 20.04.2024 | 0.647 | 0.74 | 0.595 |
© Bayerisches Landesamt für Umwelt 2024