
- Start >
- Rivers >
- Discharge >
- Obere Donau >
- Langerringen >
- Chart of year

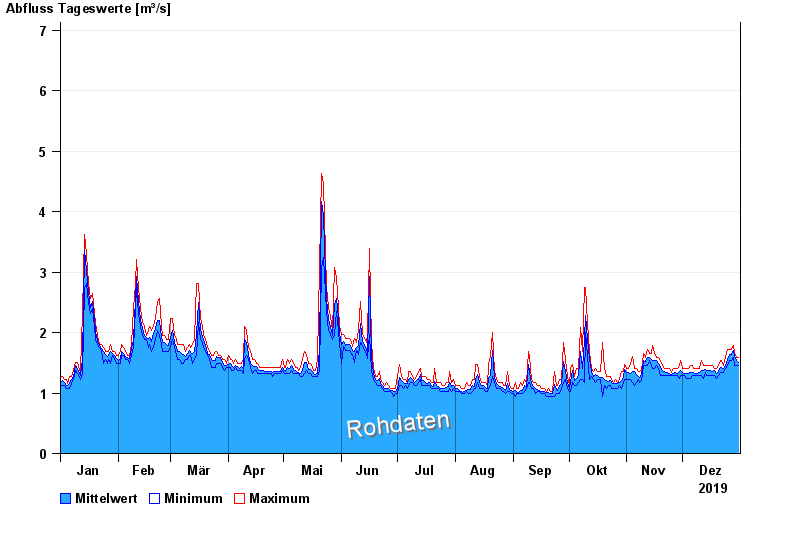
Chart of year Langerringen / Singold
Discharge from 01.01.2019 to 31.12.2019
- 11.06.1965 Abfluss: 18,7 m³/s
- 28.06.1960 Abfluss: 17,8 m³/s
- 22.04.1965 Abfluss: 14,9 m³/s
- 09.02.1958 Abfluss: 14,8 m³/s
- 25.02.1957 Abfluss: 14,4 m³/s
| Date | Mean value [m³/s] | Maximum [m³/s] | Minimum [m³/s] |
|---|---|---|---|
| 31.12.2019 | 1.5 | 1.59 | 1.46 |
| 30.12.2019 | 1.53 | 1.59 | 1.46 |
| 29.12.2019 | 1.6 | 1.65 | 1.46 |
| 28.12.2019 | 1.7 | 1.78 | 1.59 |
| 27.12.2019 | 1.64 | 1.72 | 1.53 |
| 26.12.2019 | 1.63 | 1.72 | 1.53 |
| 25.12.2019 | 1.55 | 1.72 | 1.46 |
© Bayerisches Landesamt für Umwelt 2024