
- Start >
- Rivers >
- Discharge >
- Obere Donau >
- Langerringen >
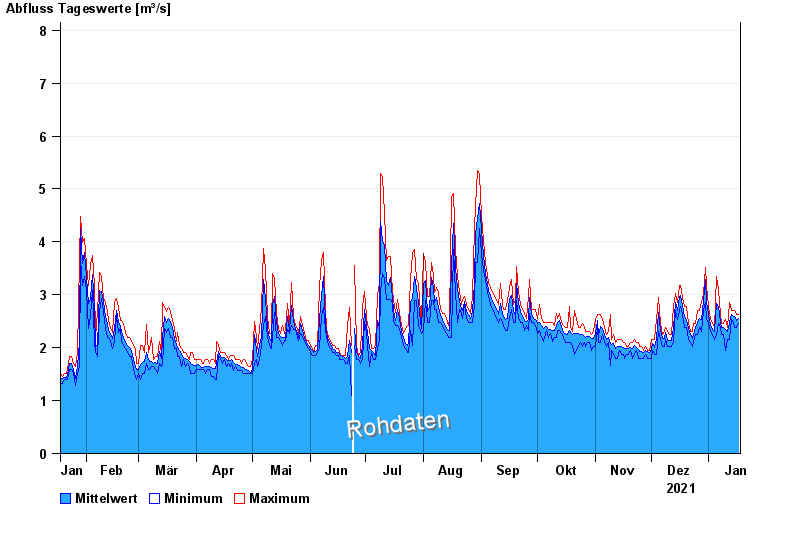
- Chart of year

Chart of year Langerringen / Singold
Discharge from 18.01.2021 to 17.01.2022
- 11.06.1965 Abfluss: 18,7 m³/s
- 28.06.1960 Abfluss: 17,8 m³/s
- 22.04.1965 Abfluss: 14,9 m³/s
- 09.02.1958 Abfluss: 14,8 m³/s
- 25.02.1957 Abfluss: 14,4 m³/s
| Date | Mean value [m³/s] | Maximum [m³/s] | Minimum [m³/s] |
|---|---|---|---|
| 17.01.2022 | 2.56 | 2.62 | 2.46 |
| 16.01.2022 | 2.52 | 2.62 | 2.39 |
| 15.01.2022 | 2.58 | 2.7 | 2.39 |
| 14.01.2022 | 2.58 | 2.7 | 2.46 |
| 13.01.2022 | 2.63 | 2.7 | 2.54 |
| 12.01.2022 | 2.48 | 2.86 | 2.16 |
| 11.01.2022 | 2.3 | 2.39 | 2.16 |
© Bayerisches Landesamt für Umwelt 2024