
- Start >
- Rivers >
- Discharge >
- Obere Donau >
- Langengeisling >
- Chart of year

Chart of year Langengeisling / Saubach
Discharge from 29.03.2024 to 28.03.2025
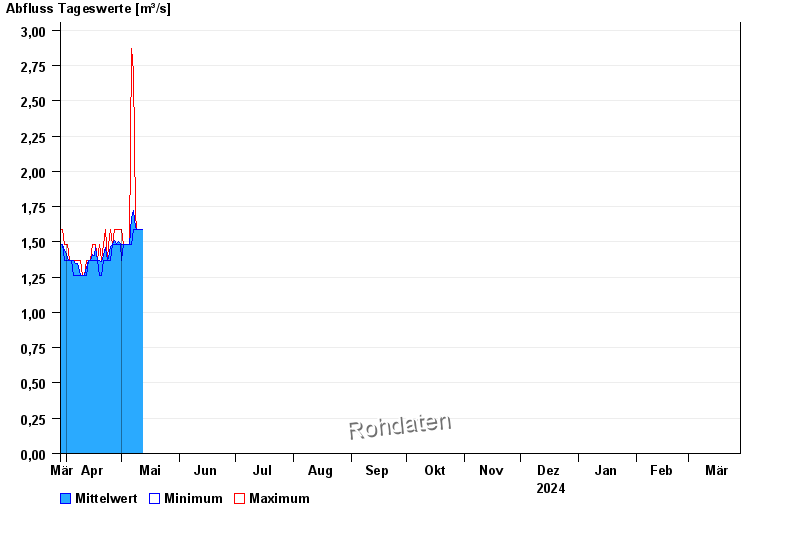
| Date | Mean value [m³/s] | Maximum [m³/s] | Minimum [m³/s] |
|---|---|---|---|
| 28.04.2024 | 1.48 | 1.48 | 1.48 |
| 27.04.2024 | 1.51 | 1.59 | 1.48 |
| 26.04.2024 | 1.48 | 1.48 | 1.48 |
| 25.04.2024 | 1.47 | 1.59 | 1.37 |
| 24.04.2024 | 1.39 | 1.48 | 1.37 |
| 23.04.2024 | 1.37 | 1.37 | 1.37 |
| 22.04.2024 | 1.46 | 1.59 | 1.37 |
© Bayerisches Landesamt für Umwelt 2024