
- Start >
- Rivers >
- Discharge >
- Obere Donau >
- Langengeisling >
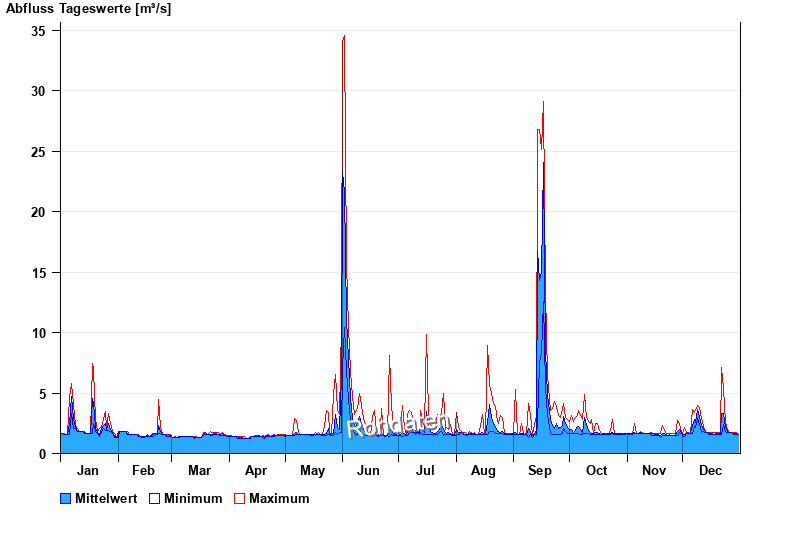
- Chart of year

Chart of year Langengeisling / Saubach
Discharge from 01.01.2024 to 31.12.2024
| Date | Mean value [m³/s] | Maximum [m³/s] | Minimum [m³/s] |
|---|---|---|---|
| 12.06.2024 | 2.14 | 2.71 | 1.71 |
| 11.06.2024 | 2.5 | 3.94 | 1.48 |
| 10.06.2024 | 3.08 | 4.95 | 1.96 |
| 09.06.2024 | 2.52 | 3.76 | 1.59 |
| 08.06.2024 | 2.12 | 3.4 | 1.48 |
| 07.06.2024 | 2.38 | 3.21 | 1.71 |
| 06.06.2024 | 2.91 | 4.73 | 1.96 |
© Bayerisches Landesamt für Umwelt 2024