
- Start >
- Rivers >
- Discharge >
- Obere Donau >
- Kelheim >
- Chart of year

Chart of year Kelheim / Donau
Discharge from 01.08.2021 to 31.07.2022
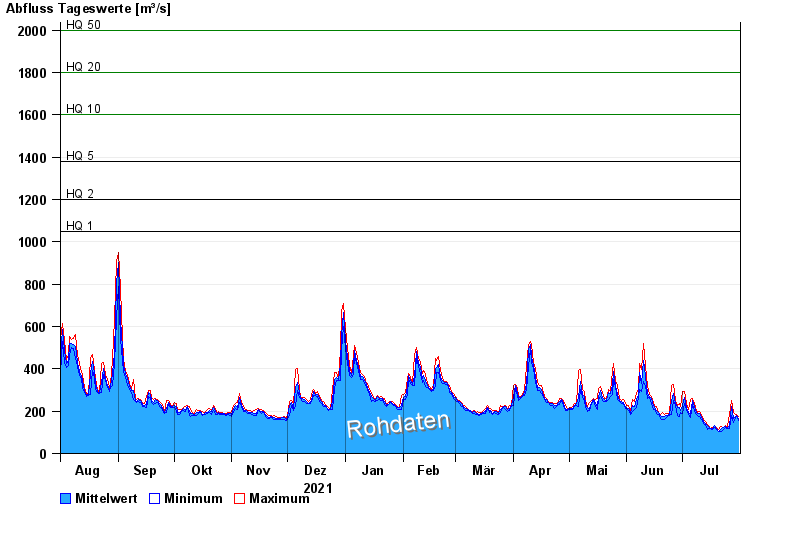
- HQ1 1050 m³/s
- HQ2 1200 m³/s
- HQ5 1380 m³/s
- HQ10 1600 m³/s
- HQ20 1800 m³/s
- HQ50 2000 m³/s
- HQ100 2200 m³/s
| Date | Mean value [m³/s] | Maximum [m³/s] | Minimum [m³/s] |
|---|---|---|---|
| 31.07.2022 | 166 | 177 | 155 |
| 30.07.2022 | 180 | 184 | 175 |
| 29.07.2022 | 169 | 190 | 155 |
| 28.07.2022 | 165 | 194 | 148 |
| 27.07.2022 | 220 | 249 | 181 |
| 26.07.2022 | 133 | 186 | 120 |
| 25.07.2022 | 124 | 127 | 120 |
© Bayerisches Landesamt für Umwelt 2024