
- Start >
- Rivers >
- Discharge >
- Obere Donau >
- Hohenkammer >
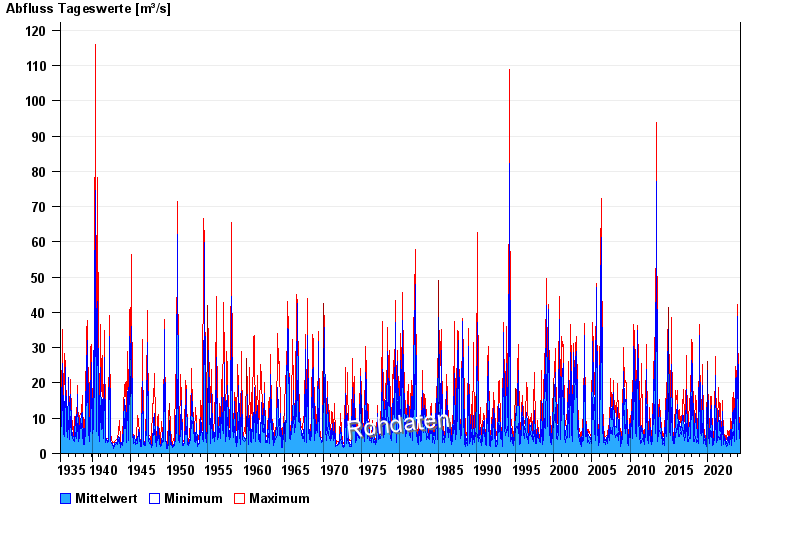
- Chart of total period

Chart of total period Hohenkammer / Glonn
Discharge from 01.11.1935 to 29.04.2024
| Date | Mean value [m³/s] | Maximum [m³/s] | Minimum [m³/s] |
|---|---|---|---|
| 29.04.2024 | 2.77 | 3.46 | 2.08 |
| 28.04.2024 | 2.88 | 3.46 | 2.19 |
| 27.04.2024 | 2.94 | 3.87 | 1.98 |
| 26.04.2024 | 3 | 3.6 | 2.19 |
| 25.04.2024 | 3.21 | 3.73 | 2.5 |
| 24.04.2024 | 3.26 | 4.01 | 2.29 |
| 23.04.2024 | 3.21 | 3.87 | 2.5 |
© Bayerisches Landesamt für Umwelt 2024