
- Start >
- Rivers >
- Discharge >
- Obere Donau >
- Hof >
- Chart of total period

Chart of total period Hof / Sächsische Saale
Discharge from 01.11.1920 to 30.04.2024
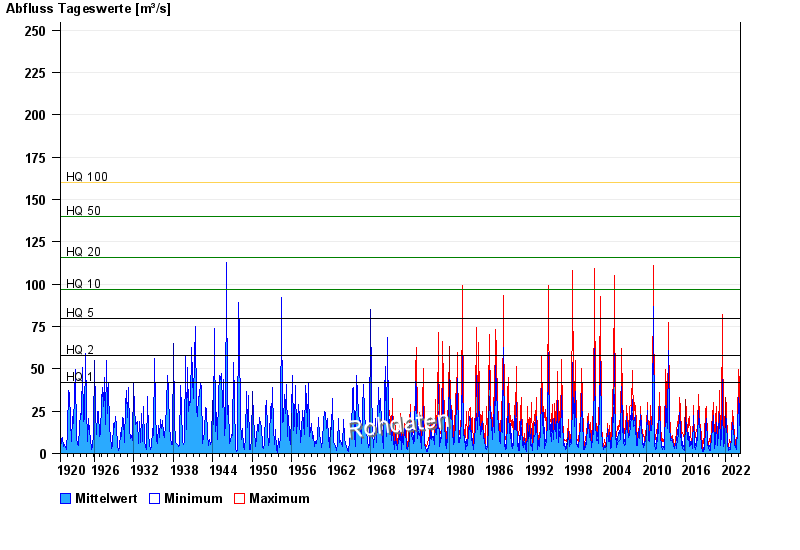
- HQ1 42 m³/s
- HQ2 58 m³/s
- HQ5 80 m³/s
- HQ10 97 m³/s
- HQ20 116 m³/s
- HQ50 140 m³/s
- HQ100 160 m³/s
| Date | Mean value [m³/s] | Maximum [m³/s] | Minimum [m³/s] |
|---|---|---|---|
| 30.04.2024 | 3.01 | 3.06 | 2.96 |
| 29.04.2024 | 3.1 | 3.26 | 2.96 |
| 28.04.2024 | 3.35 | 3.47 | 3.26 |
| 27.04.2024 | 3.68 | 3.9 | 3.47 |
| 26.04.2024 | 4.07 | 4.25 | 3.9 |
| 25.04.2024 | 4.06 | 4.25 | 3.9 |
| 24.04.2024 | 4.14 | 5.4 | 2.78 |
© Bayerisches Landesamt für Umwelt 2024