
- Start >
- Rivers >
- Discharge >
- Obere Donau >
- Heroldingen >
- Chart of year

Chart of year Heroldingen / Wörnitz
Discharge from 26.09.2020 to 25.09.2021
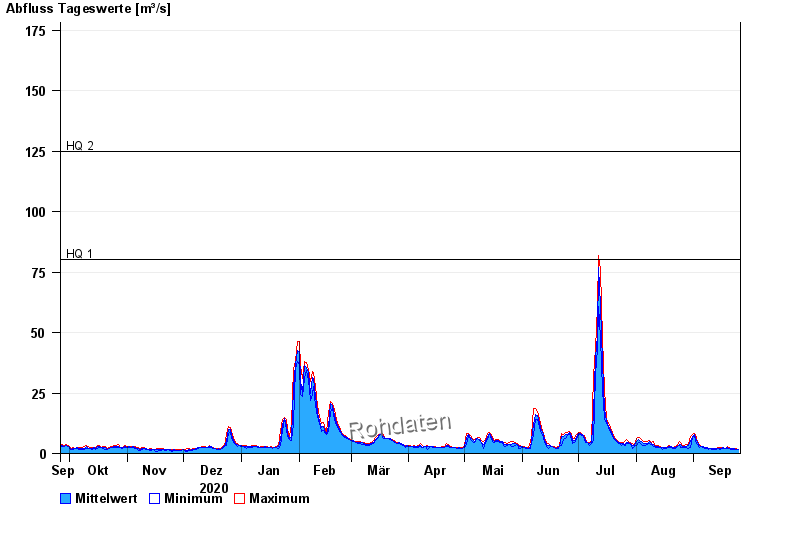
- HQ1 80 m³/s
- HQ2 125 m³/s
- HQ5 180 m³/s
- HQ10 225 m³/s
- HQ20 275 m³/s
- HQ50 345 m³/s
- HQ100 410 m³/s
| Date | Mean value [m³/s] | Maximum [m³/s] | Minimum [m³/s] |
|---|---|---|---|
| 25.09.2021 | 1.57 | 1.67 | 1.49 |
| 24.09.2021 | 1.86 | 2.05 | 1.67 |
| 23.09.2021 | 1.88 | 2.05 | 1.76 |
| 22.09.2021 | 1.87 | 2.05 | 1.49 |
| 21.09.2021 | 1.88 | 2.25 | 1.49 |
| 20.09.2021 | 2.23 | 2.35 | 2.15 |
| 19.09.2021 | 2.39 | 2.78 | 2.15 |
© Bayerisches Landesamt für Umwelt 2024