
- Start >
- Rivers >
- Discharge >
- Obere Donau >
- Heroldingen >
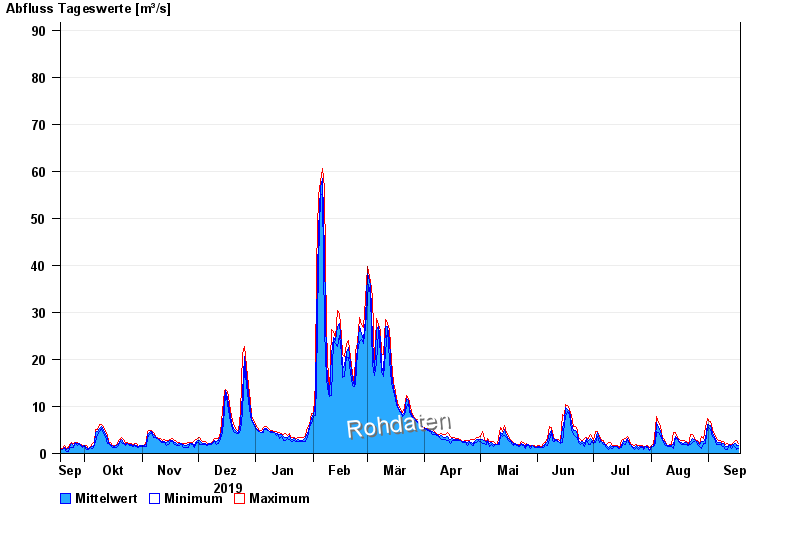
- Chart of year

Chart of year Heroldingen / Wörnitz
Discharge from 18.09.2019 to 17.09.2020
- 21.12.1993 Abfluss: 409 m³/s
- 14.04.1994 Abfluss: 401 m³/s
- 17.03.1988 Abfluss: 299 m³/s
- 31.01.1982 Abfluss: 279 m³/s
- 30.10.1998 Abfluss: 199 m³/s
| Date | Mean value [m³/s] | Maximum [m³/s] | Minimum [m³/s] |
|---|---|---|---|
| 17.09.2020 | 1.6 | 2.11 | 0.981 |
| 16.09.2020 | 1.79 | 2.69 | 0.862 |
| 15.09.2020 | 2.04 | 2.69 | 1.27 |
| 14.09.2020 | 1.81 | 2.3 | 1.67 |
| 13.09.2020 | 1.61 | 2.01 | 0.981 |
| 12.09.2020 | 1.85 | 1.93 | 1.67 |
| 11.09.2020 | 1.45 | 2.11 | 0.806 |
© Bayerisches Landesamt für Umwelt 2024