
- Start >
- Rivers >
- Discharge >
- Obere Donau >
- Heroldingen >
- Chart of year

Chart of year Heroldingen / Wörnitz
Discharge from 01.01.2022 to 31.12.2022
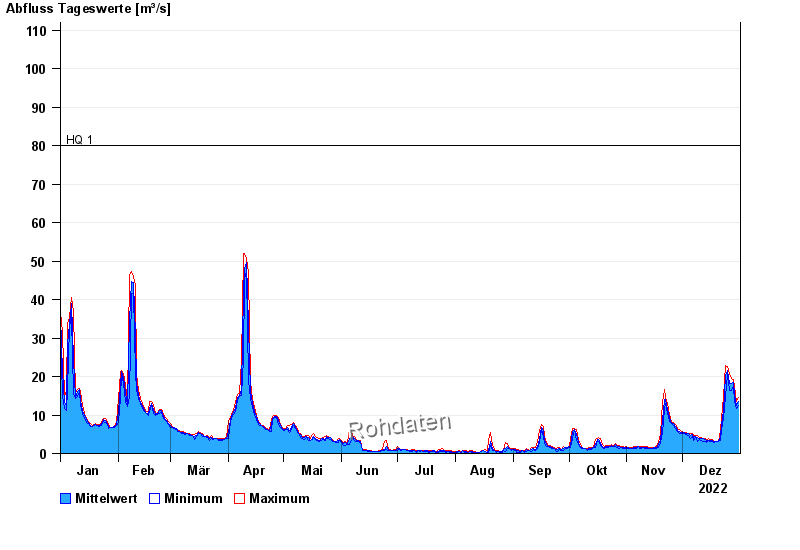
- HQ1 80 m³/s
- HQ2 125 m³/s
- HQ5 180 m³/s
- HQ10 225 m³/s
- HQ20 275 m³/s
- HQ50 345 m³/s
- HQ100 410 m³/s
| Date | Mean value [m³/s] | Maximum [m³/s] | Minimum [m³/s] |
|---|---|---|---|
| 31.12.2022 | 13.4 | 14.5 | 12.5 |
| 30.12.2022 | 12.5 | 13.4 | 11.8 |
| 29.12.2022 | 15.3 | 17.5 | 13.4 |
| 28.12.2022 | 18.5 | 19.2 | 17.5 |
| 27.12.2022 | 18.1 | 19.6 | 16.3 |
| 26.12.2022 | 18.2 | 20.4 | 16.3 |
| 25.12.2022 | 21.6 | 22.6 | 20.4 |
© Bayerisches Landesamt für Umwelt 2024