
- Start >
- Rivers >
- Discharge >
- Obere Donau >
- Heroldingen >
- Chart of year

Chart of year Heroldingen / Wörnitz
Discharge from 23.09.2021 to 22.09.2022
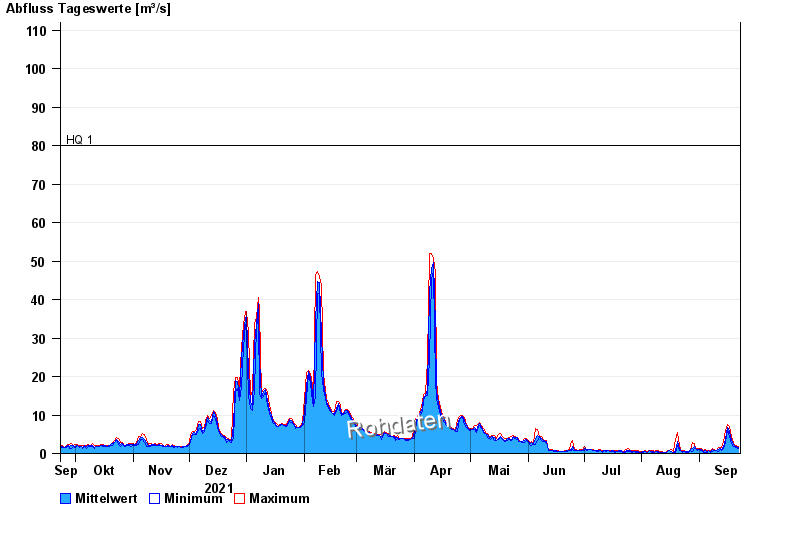
- HQ1 80 m³/s
- HQ2 125 m³/s
- HQ5 180 m³/s
- HQ10 225 m³/s
- HQ20 275 m³/s
- HQ50 345 m³/s
- HQ100 410 m³/s
| Date | Mean value [m³/s] | Maximum [m³/s] | Minimum [m³/s] |
|---|---|---|---|
| 22.09.2022 | 1.52 | 1.8 | 1.39 |
| 21.09.2022 | 1.91 | 2.14 | 1.51 |
| 20.09.2022 | 1.84 | 2.05 | 1.72 |
| 19.09.2022 | 2.31 | 2.86 | 1.88 |
| 18.09.2022 | 3.4 | 4.37 | 2.64 |
| 17.09.2022 | 5.62 | 6.94 | 4.37 |
| 16.09.2022 | 6.78 | 7.42 | 6.14 |
© Bayerisches Landesamt für Umwelt 2024