
- Start >
- Rivers >
- Discharge >
- Obere Donau >
- Heroldingen >
- Chart of year

Chart of year Heroldingen / Wörnitz
Discharge from 23.09.2019 to 22.09.2020
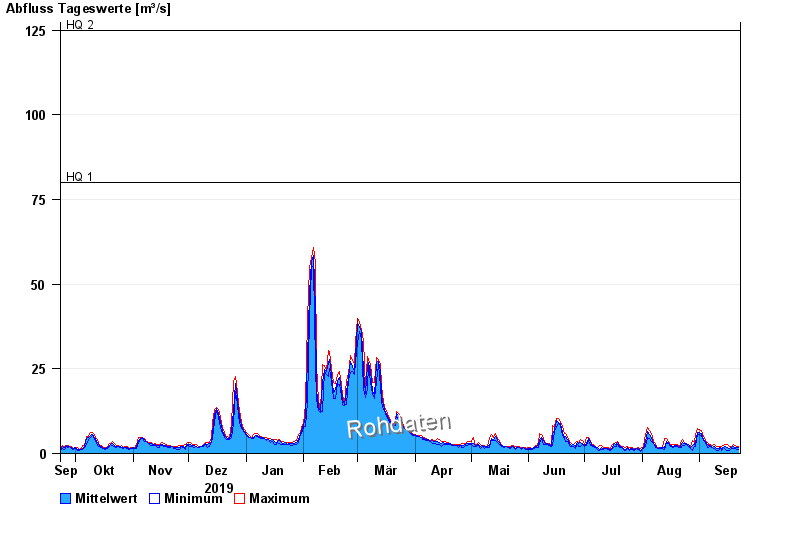
- HQ1 80 m³/s
- HQ2 125 m³/s
- HQ5 180 m³/s
- HQ10 225 m³/s
- HQ20 275 m³/s
- HQ50 345 m³/s
- HQ100 410 m³/s
| Date | Mean value [m³/s] | Maximum [m³/s] | Minimum [m³/s] |
|---|---|---|---|
| 22.09.2020 | 1.63 | 2.11 | 1.27 |
| 21.09.2020 | 1.78 | 1.93 | 1.27 |
| 20.09.2020 | 1.9 | 2.3 | 1.5 |
| 19.09.2020 | 1.92 | 2.69 | 1.43 |
| 18.09.2020 | 1.73 | 1.93 | 1.5 |
| 17.09.2020 | 1.6 | 2.11 | 0.981 |
| 16.09.2020 | 1.79 | 2.69 | 0.862 |
© Bayerisches Landesamt für Umwelt 2024